The “Digital 2026 Global Overview Report” presents an up-to-date and detailed view of global digital behavior as of late 2025. It highlights major trends ranging from social media usage to generative AI adoption. Notably, by October 2025 generative AI had become a part of everyday work and daily routines. Monthly usage of LLMs and GenAI surpassed one billion people, firmly establishing AI as a mainstream tool.
The report highlights several key findings for this year:
- More than 6 billion people now use the internet
- Social media users have reached a “super-majority” status
- Over 1 billion people now use AI every month
- Insights into what people actually use AI for
- Major new numbers on digital connectivity in India and China
- A look at the world’s most popular social platforms
- The state of global advertising
- Search forecasts as AI adoption accelerates
- The changing face of television
- The evolution of user expectations from social networks
The report is based on data from: GWI, Statista, GSMA Intelligence, Semrush, SimilarWeb, Ookla, SocialInsider, Skai. You can view the full Digital 2026 Global Overview Report presentation at the end of this article.
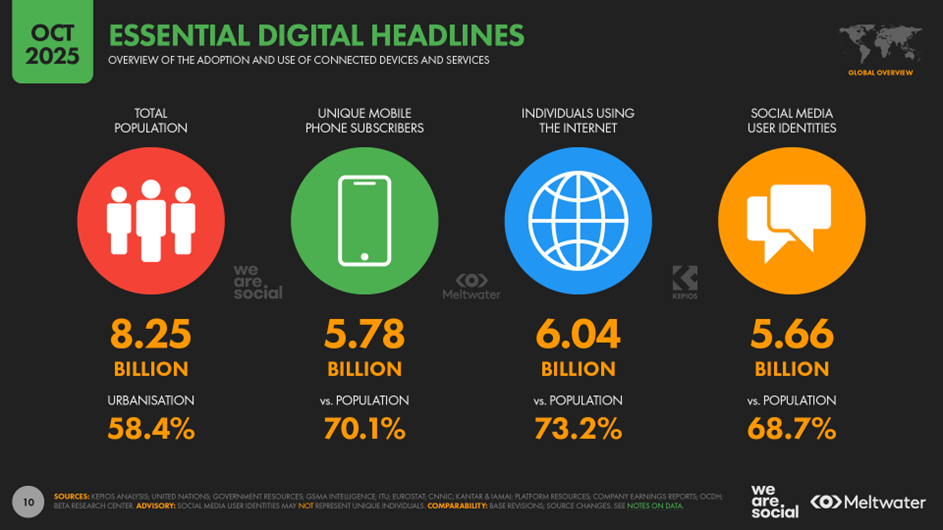
The state of digital technology in October 2025
- World population: 8.25 billion people. Annual growth +0.8%. 58.4% live in urban areas.
- Mobile connections: 5.78 billion unique subscribers (70.1% of the population). Growth +1.9%. Smartphones represent 86.9% of all handsets.
- Internet: 6.04 billion users (73.2% penetration). Growth +5.1% year-over-year. 2.2 billion people remain offline.
- Social media: 5.66 billion user identifiers (68.7% of the population). Growth +4.8% year-over-year.
Internet connection speeds
As of October 2025, fixed broadband remains faster and more stable, offering a median download speed of 104.43 Mbps (with just 8 ms latency), an 11.1% increase year-over-year. Mobile internet shows explosive growth (+62.6% year-over-year), reaching a median download speed of 90.69 Mbps, although its latency (25 ms) remains higher compared to fixed connections.

Demographic trends
- Current population: 8.25 billion people.
- The population has grown by a quarter billion in under three years.
- Annual growth is 0.8%, well below the 1960s peak of 2.3% and the 2000s rate of 1.2%.
- In the past year the world added 69 million people (+2.2 per second).
- Since the early internet era (30+ years), the global population has increased by more than 50%.

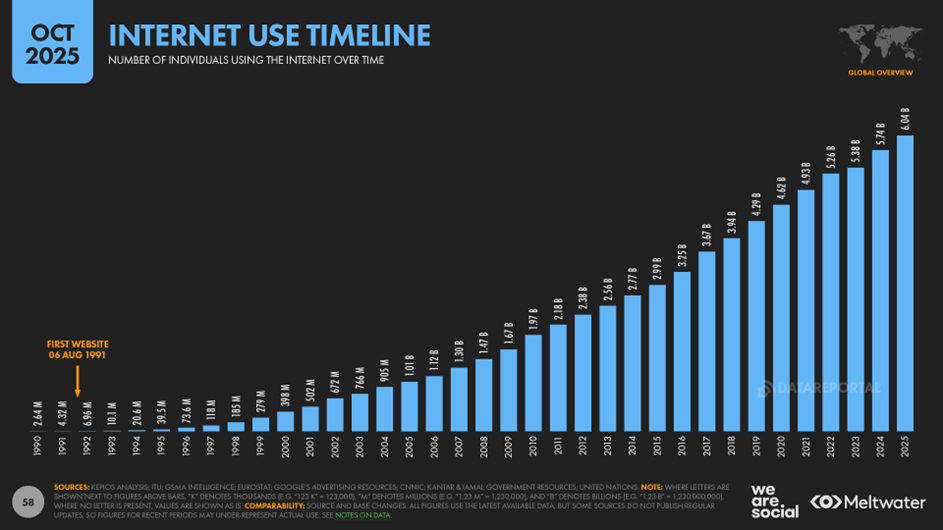
Growth of internet users
- 6.04 billion people now use the internet, with penetration reaching 73.2%.
- The number of users has doubled in less than 11 years (from 3 billion in 2014).
- Internet users increased by 294 million in the past year (+5.1%).
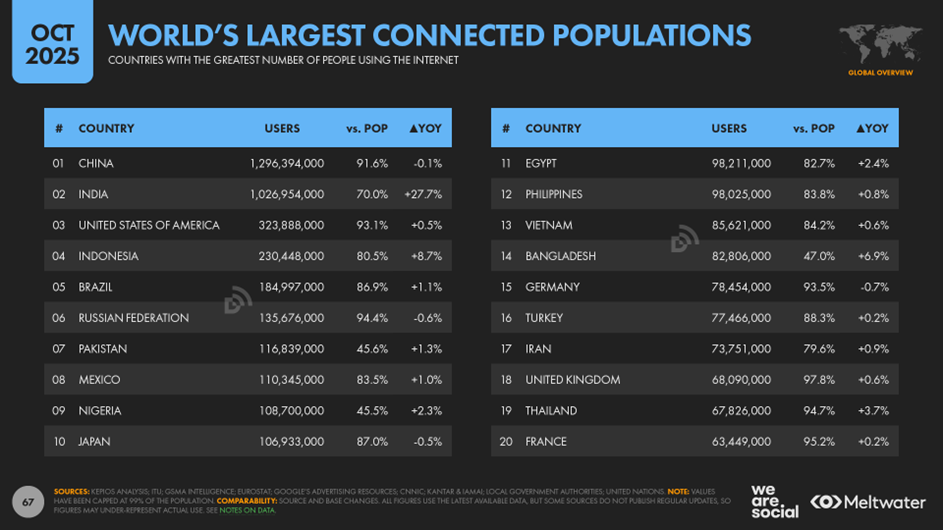
Shifts in the landscape (New data sources)
- India: surpassed 1 billion internet users after data adjustments (70.0% penetration among people aged 15+).
- China: official penetration revised to 91.6%, giving the country nearly 1.3 billion users (≈21.5% of global internet users).
Digital inequality
2.21 billion people remain offline (more than one in four), mostly in South Asia and Central Africa.
- Largest offline population: India (440+ million).
- Lowest penetration: North Korea (<1%).
Globally, women and rural residents access the internet less often. 70.7% of women are online compared to 75.7% of men — roughly 240 million more men online.
Only 54.5% of rural populations are online versus 86.5% in urban areas.
Although 58.4% of the world’s population lives in cities, urban users account for nearly 7 in 10 internet users (69.1%).
In some countries (e.g., CAR), the cheapest internet plan may cost 26.7% of the average monthly income.
Social media users
Globally, there are 5.66 billion active social media user identifiers, representing 68.7% of the world’s population. This means more than two in three people on Earth use social media every month.
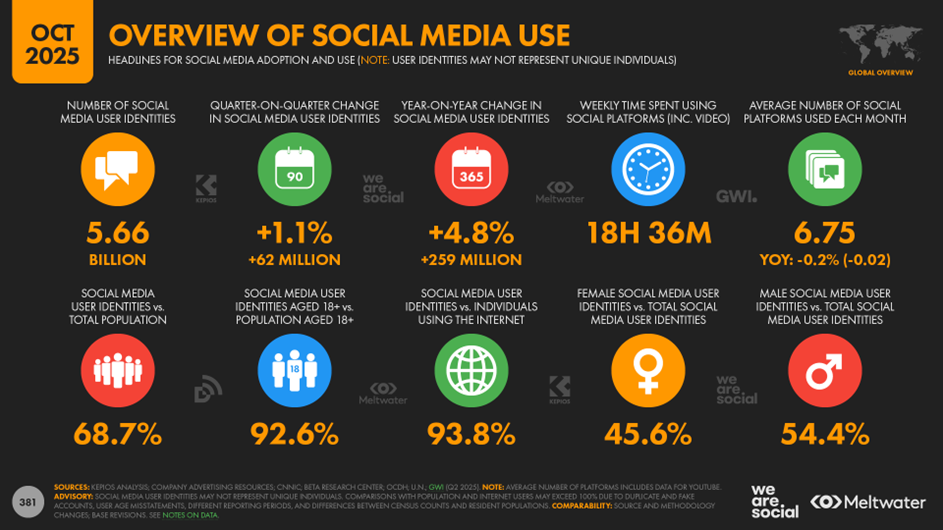
In the past year alone, 259 million new identifiers were added, and more than half of all current users joined social platforms within the past decade.

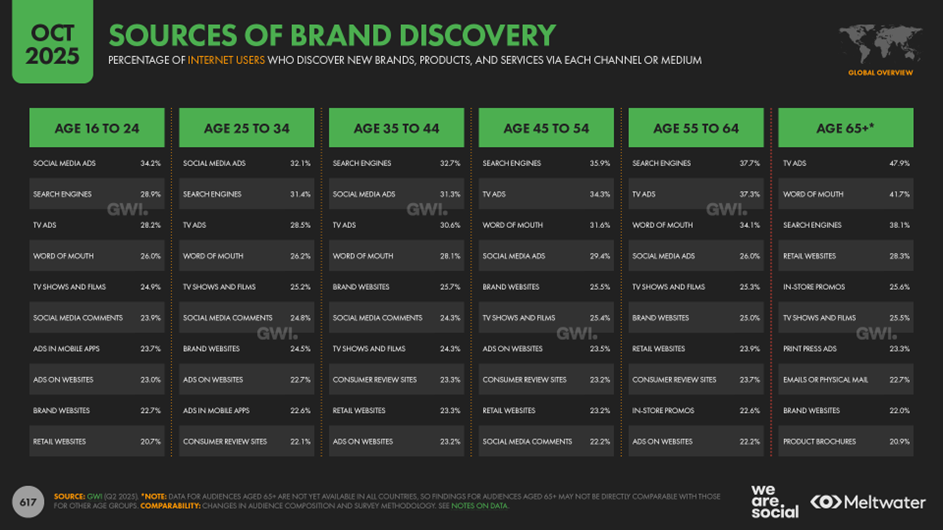
Social media advertising remains the third most important source of brand discovery for internet users and is the leading driver for the 16–34 age group.
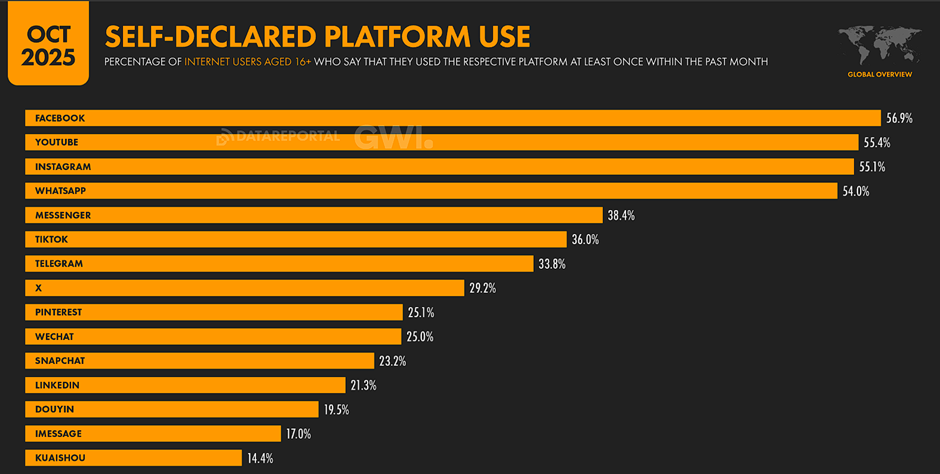
Among global internet users aged 16+, Facebook (56.9%) remains the most-used platform, followed closely by YouTube (55.4%), Instagram (55.1%), and WhatsApp (54.0%).
The Meta ecosystem (Facebook, Instagram, WhatsApp, Messenger) dominates usage frequency, holding four of the top six positions.
Platforms such as Telegram, X, Pinterest, and WeChat are used by roughly a quarter to a third of users.
Social media advertising audience: Adults 18+
In terms of potential advertising reach among adults (18+), Facebook (2.34B) and YouTube (2.31B) lead with nearly identical figures. They are followed by TikTok (1.99B) and Instagram (1.84B). Together, these four platforms form the core of adult reach. LinkedIn (1.33B) takes fifth place. Other platforms — Messenger (941M), Snapchat (601M), X (529M), and Pinterest (305M) — have significantly smaller reach, with Threads at the bottom (141M).

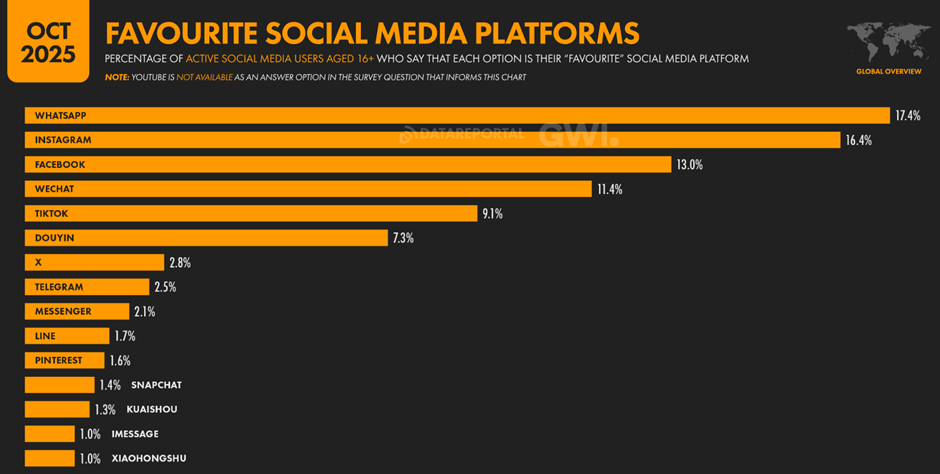
Among active social media users (16+), WhatsApp (17.4%) ranks as the most loved platform, followed by Instagram (16.4%) and Facebook (13.0%). Meta platforms occupy the entire podium. WeChat (11.4%) and TikTok (9.1%) round out the top five. All other platforms, including Douyin (7.3%), X (2.8%), and Telegram (2.5%), hold much smaller “favorite” shares.
TikTok leads by average daily usage time, with 1 hour 37 minutes per active user. It is followed by YouTube (1 hour 25 minutes). Instagram (1 hour 13 minutes) and Facebook (1 hour 7 minutes) also show strong engagement, each exceeding one hour per day. Other platforms — WhatsApp (59 min), IMO (53 min), and Telegram (30 min) — rank lower. X, Reddit, Messenger, and Snapchat fall below 20 minutes, while LinkedIn and Threads show the lowest usage time.

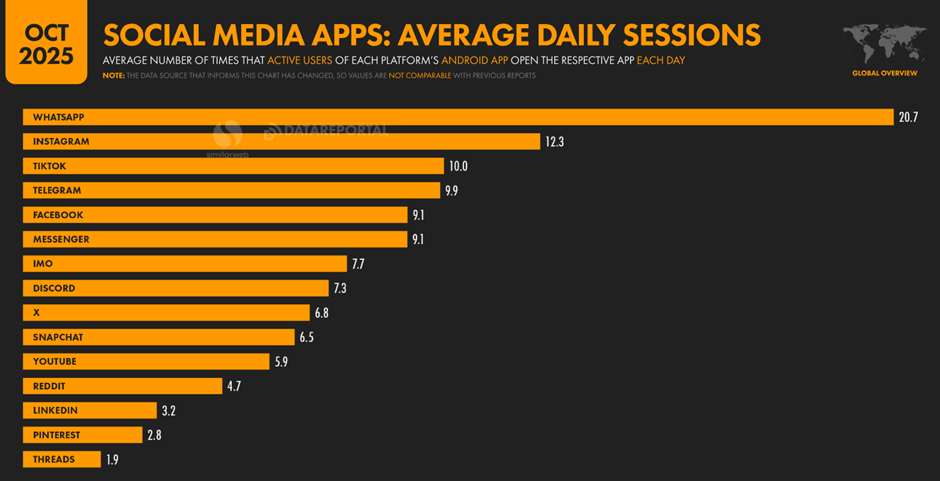
Average number of daily sessions
WhatsApp is the clear leader with an average of 20.7 sessions per active user per day. It is followed by Instagram (12.3) and TikTok (10.0). Telegram (9.9), Facebook (9.1), and Messenger (9.1) also show high frequency. YouTube has relatively fewer sessions (5.9), indicating longer viewing periods per session. Threads ranks last with 1.9 sessions per day.
Average session duration
YouTube leads in session duration at 14 minutes 29 seconds. TikTok follows with 9 minutes 42 seconds. Facebook (7 minutes 17 seconds) and Instagram (5 minutes 56 seconds) take third and fifth place respectively. Messaging-oriented platforms like Telegram (3 minutes 1 second), WhatsApp (2 minutes 52 seconds), and Messenger (2 minutes 03 seconds) naturally show much shorter sessions.

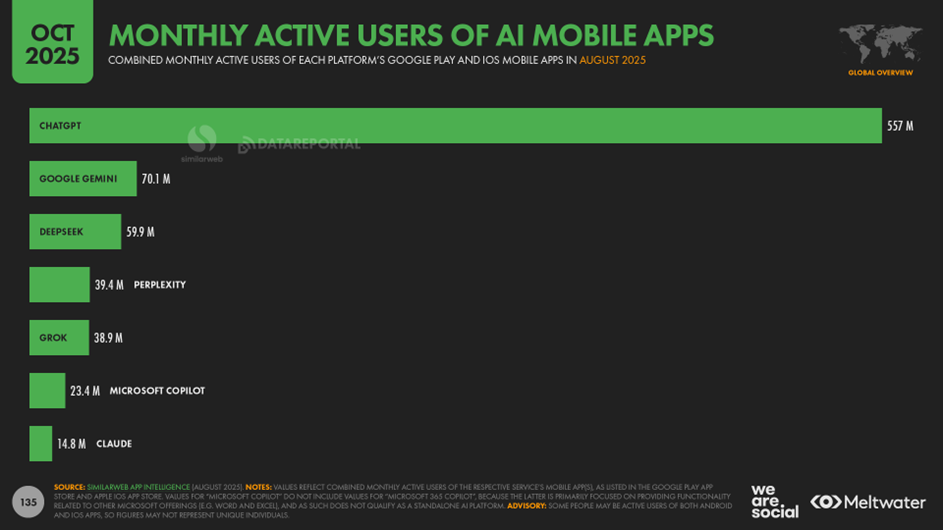
AI usage
Analysis by Kepios shows that more than 1 billion people now use large language models (LLMs) and generative AI (GenAI) platforms every month.
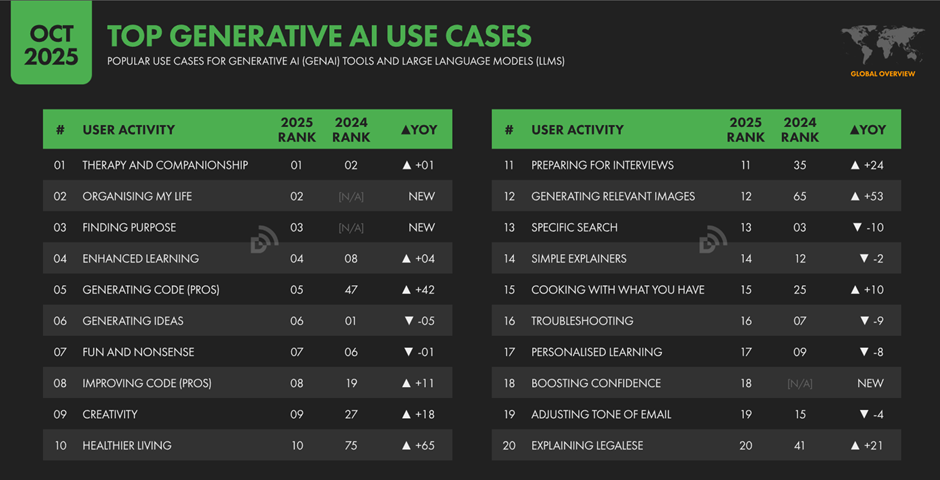
By October 2025, generative AI had become deeply integrated into both personal life and professional workflows.
Whereas in 2024 users focused mainly on general tasks (search, idea generation), 2025 brought a rise in niche, practical, and personally oriented use cases (life organization, therapy, coding, wellness).
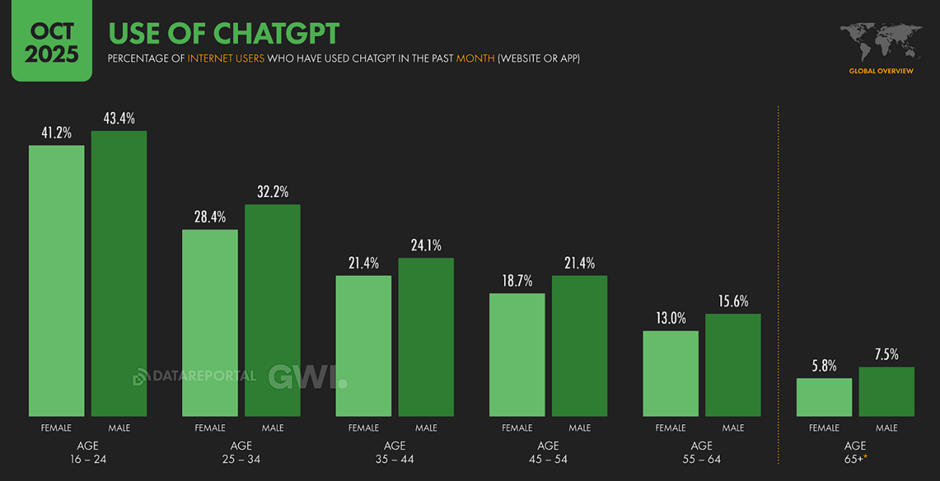
Demographic distribution of ChatGPT users
- Highest usage is among men aged 16–24 (43.4%).
- Lowest usage is among women aged 65+ (5.8%).
- Usage declines steadily with each older age group.
- Men use ChatGPT more often than women across all measured age categories.
Advertising spend trends
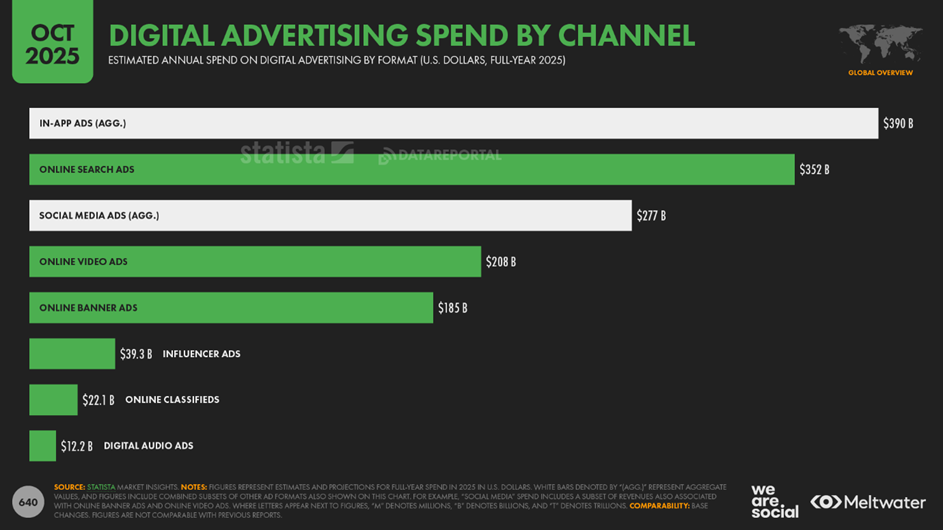
According to Statista, global marketing spend will reach USD 1.16 trillion in 2025, up 6.5% from 2024. Digital channels will dominate, accounting for 74.4% of total ad spend (up from 72.7% in 2024).
In 2025, in-app advertising (USD 390B), search advertising (USD 352B), and social media advertising (USD 277B) represent the largest portions of global digital ad spend. Search and in-app formats lead the market, far ahead of online video (USD 208B) and banner ads (USD 185B), while digital audio and influencer advertising hold the smallest shares.
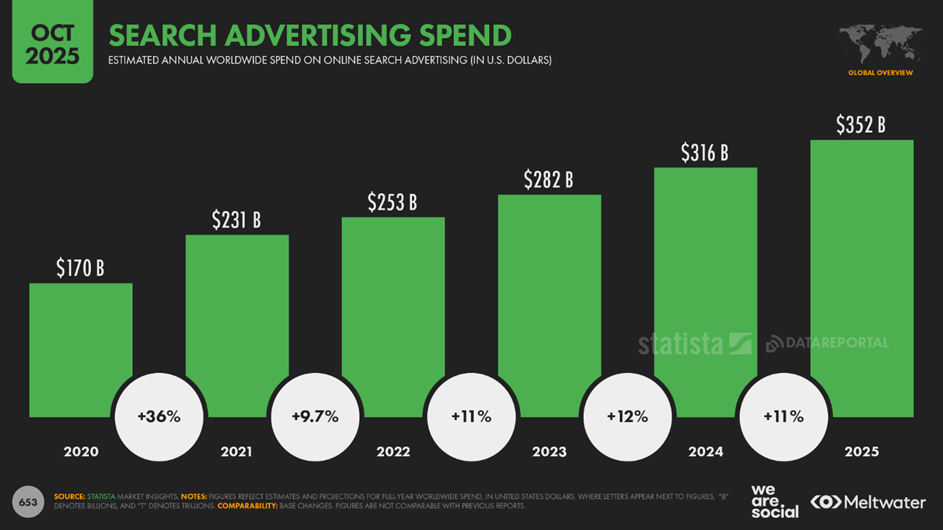
Search advertising
Search ads remain the top choice among marketers by overall share of advertising spend.
According to Statista, global spend on search advertising is projected to reach USD 352 billion in 2025.
Investment in search continues to grow rapidly: global annual growth is forecast at 11.1% for 2025. Search has become one of the biggest beneficiaries of the global shift toward digital, with search ad spend more than doubling since 2020.
Social media ad spend continues its upward trajectory. In 2025, global social media advertising spend will grow by 13.6% year-over-year, reaching USD 277 billion — more than USD 5 billion per week.
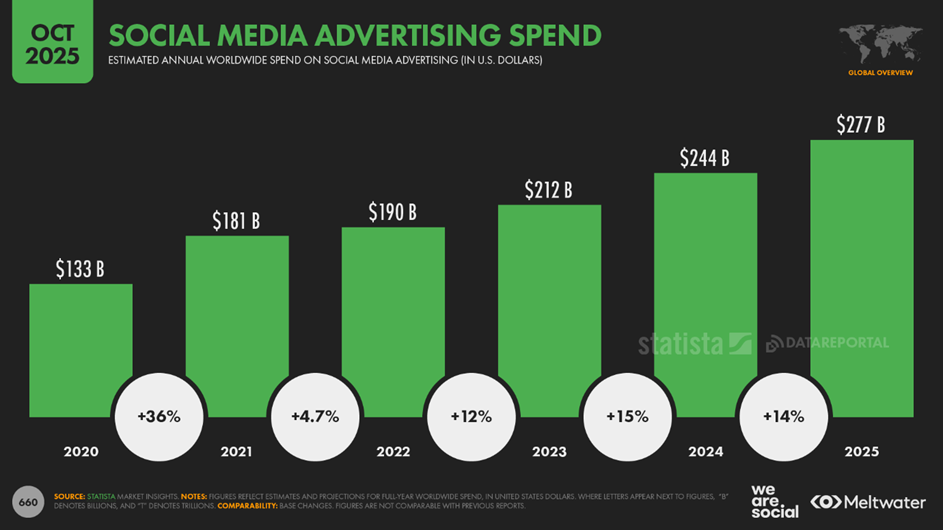
The share of social media advertising is expected to reach 32.1% of all digital ad spend in 2025.

Cryptocurrency
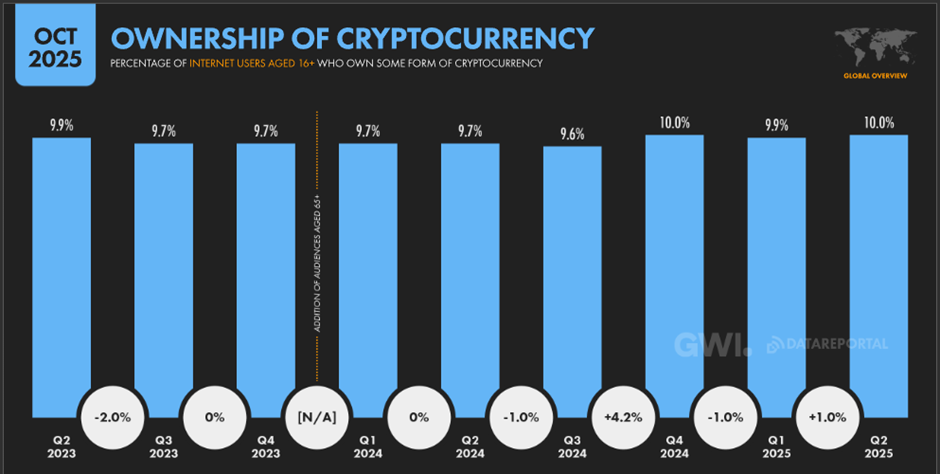
Crypto ownership
The share of global internet users (16+) who own cryptocurrency remains stable at around 9.6%–10.0% over the past two years.
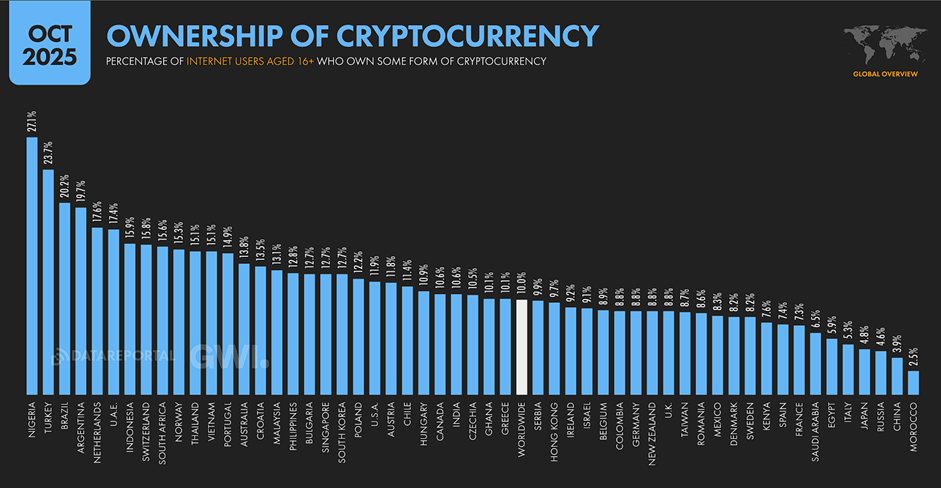
Crypto ownership by country
Global ownership stands at 10.0%. Nigeria (27.1%) and Turkey (23.7%) lead with the highest adoption rates. Many countries fall within the 11%–17% range, while Western Europe and the United States hover near the global average. The lowest ownership rates are seen in China (3.9%) and Morocco (2.5%).
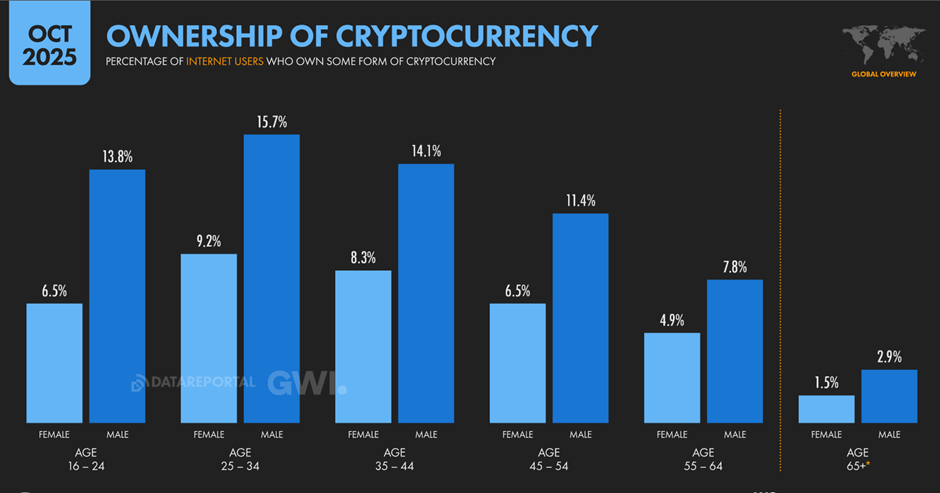
Crypto ownership by gender and age
Crypto ownership skews heavily male across all age groups. Peak ownership occurs among people aged 25–34, with men at 15.7% and women at 9.2%.
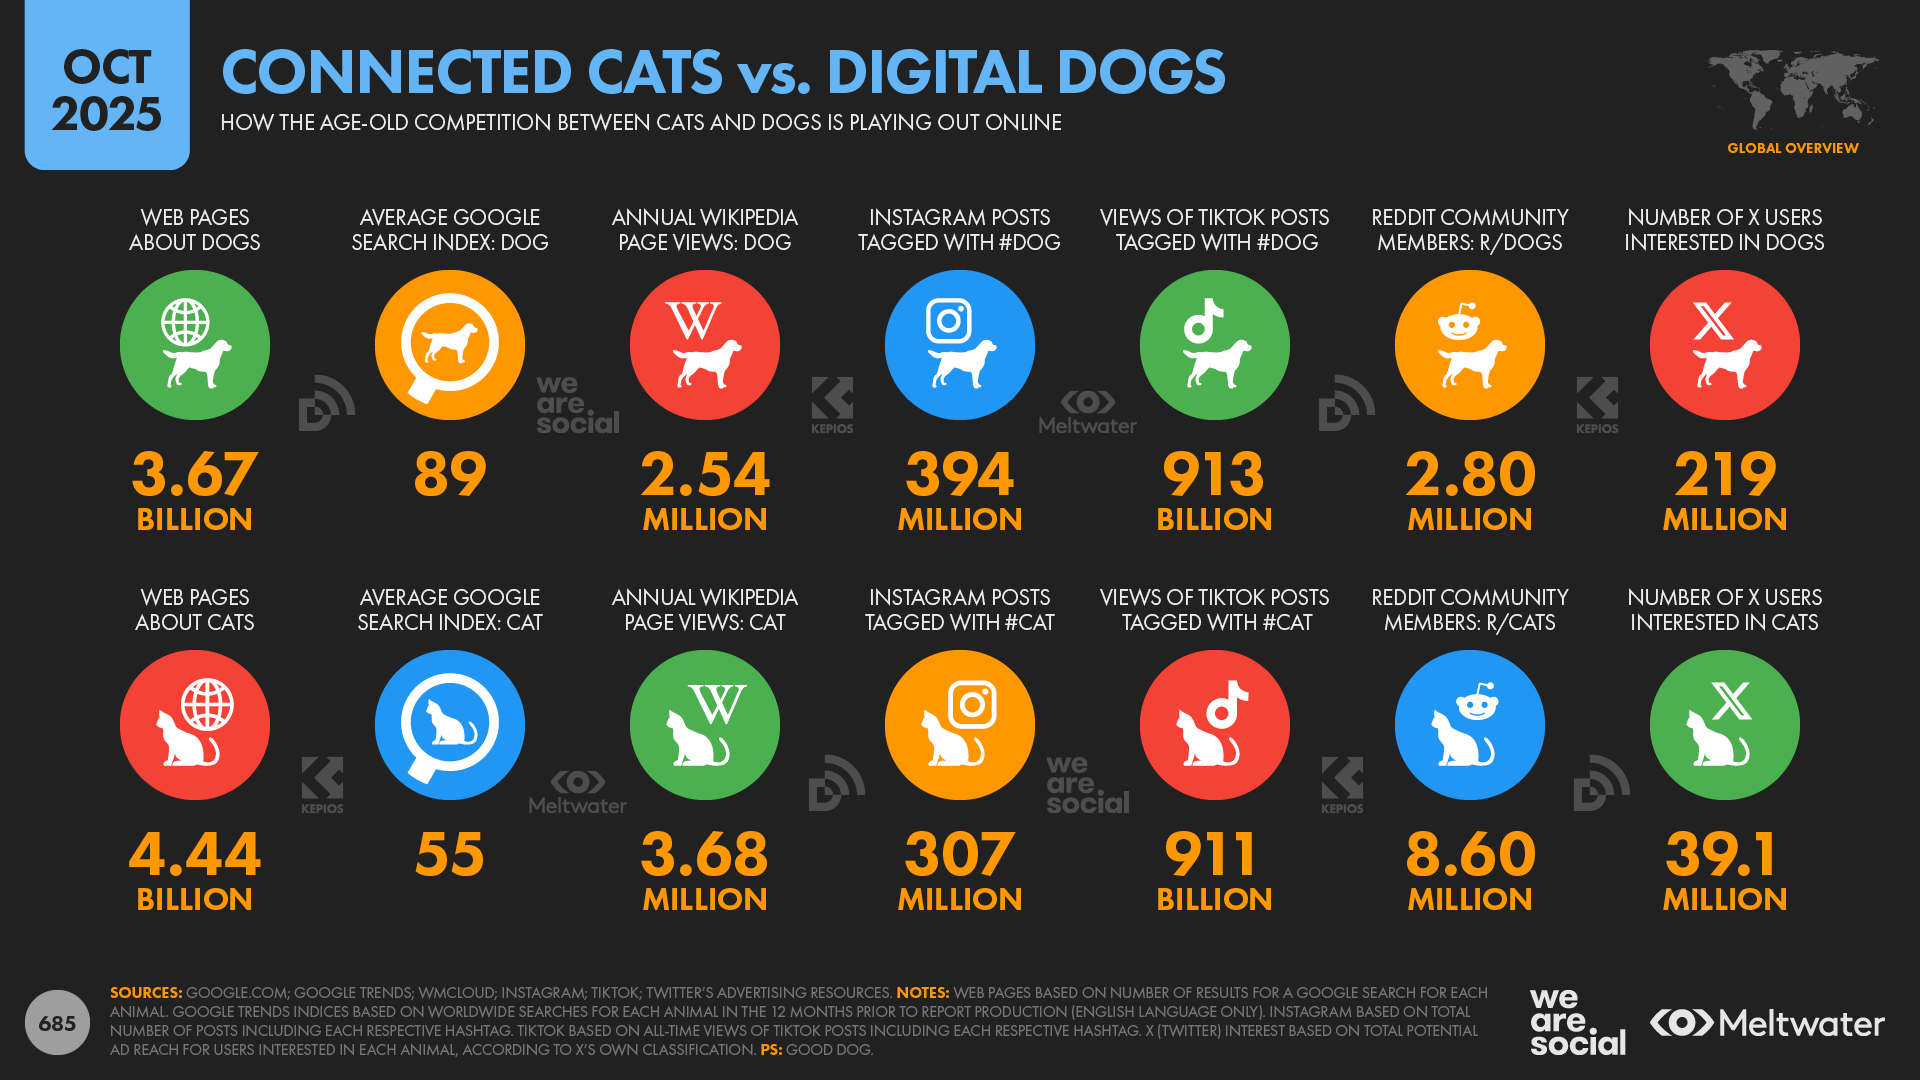
Cats vs. dogs on the internet
Although the internet began as a serious technical project (ARPANET), cats and dogs have effectively conquered it thanks to massive meme culture and viral content, becoming one of its most beloved and defining phenomena.
Cats lead in sheer volume of content: there are 4.44 billion web pages about cats — 20% more than about dogs. Users also show deeper interest in cats, viewing cat-related Wikipedia articles 8.65 million times across all languages versus 5.59 million for dog-related articles.
However, dogs dominate in active search and on most social platforms. According to Google Trends, dogs are searched 60% more often than cats (index 89 vs 55). On social platforms, such as Instagram (28% more #dog posts) and X (219 million users “interested in dogs” vs 39 million “interested in cats”), dogs also lead in reach. On TikTok, views are nearly equal (913B vs 911B), but dog videos are posted more frequently.
Despite dogs dominating search and overall media reach, the analysis concludes that cats still hold the top spot on the internet at the end of 2025 — but only narrowly — driven by deeper engagement and a larger share of created content.
Full report
The full presentation of the Digital 2026 Global Overview Report: