The Tinuiti Digital Ads Benchmark report, based on anonymised data from US advertising campaigns with annual spending of over $4 billion, recorded a 10% increase in Google search advertising spending in the third quarter of 2025, with click growth accelerating to 11% and the cost per click (CPC) decreased by 1%. The main event of the quarter was Amazon’s departure from US product auctions in July, which reduced competitive pressure on the cost per click and provided an influx of traffic to other retailers.
Search advertising
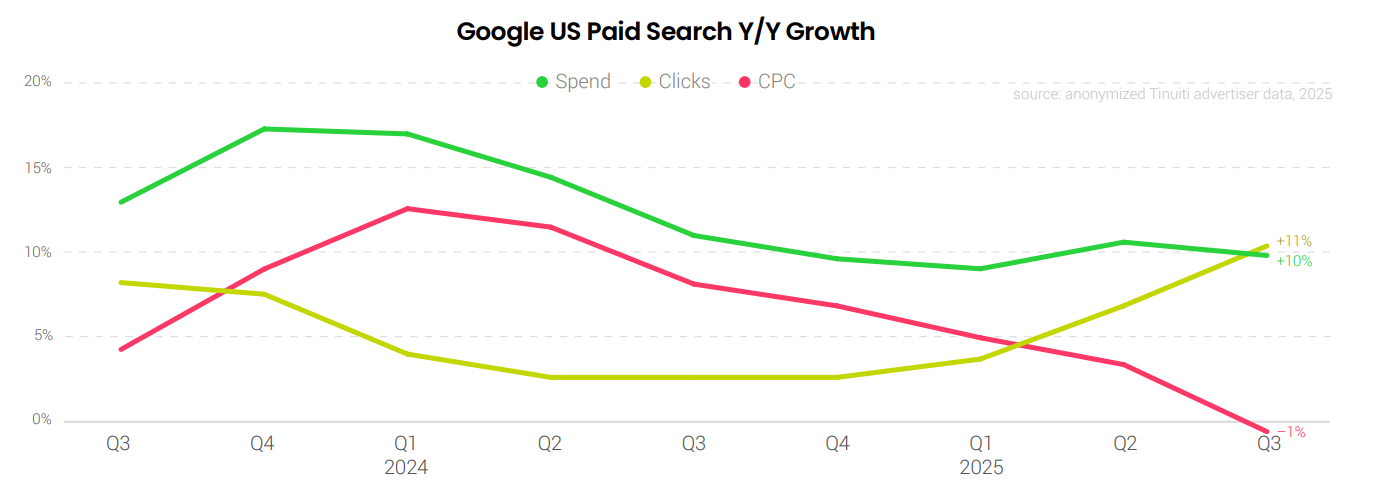
- Advertisers’ spending on Google’s paid search advertising in the third quarter of 2025 grew by 10% year over year, 1% below the second quarter.
- Click growth accelerated for the fifth consecutive quarter, reaching 11%, but the average cost per click fell by 1% for the first time in two years.
Google Shopping campaigns
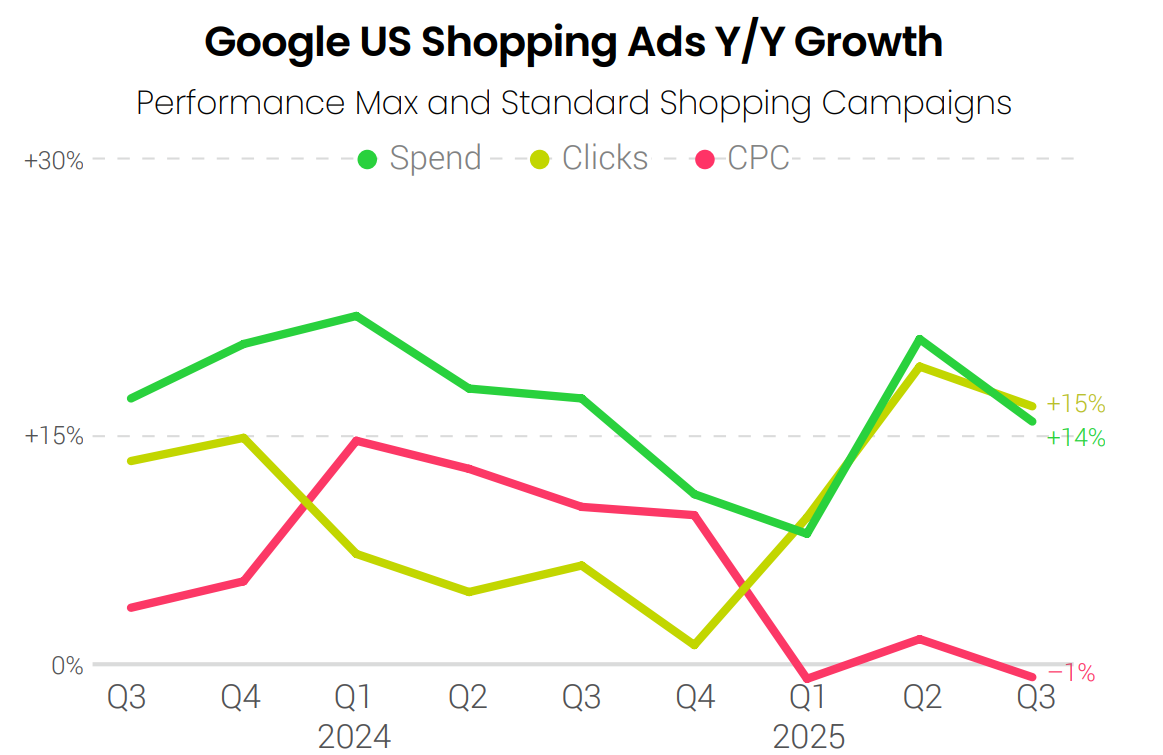
- Advertising spending on Google Shopping increased by 14% compared to the same period in the third quarter of 2025.
- Clicks increased by 15% and CPC decreased by 1%.
Performance Max (PMax)
- Among companies using both formats, there is a clear trend towards reallocating spending back to Performance Max after a decline at the beginning of the year.
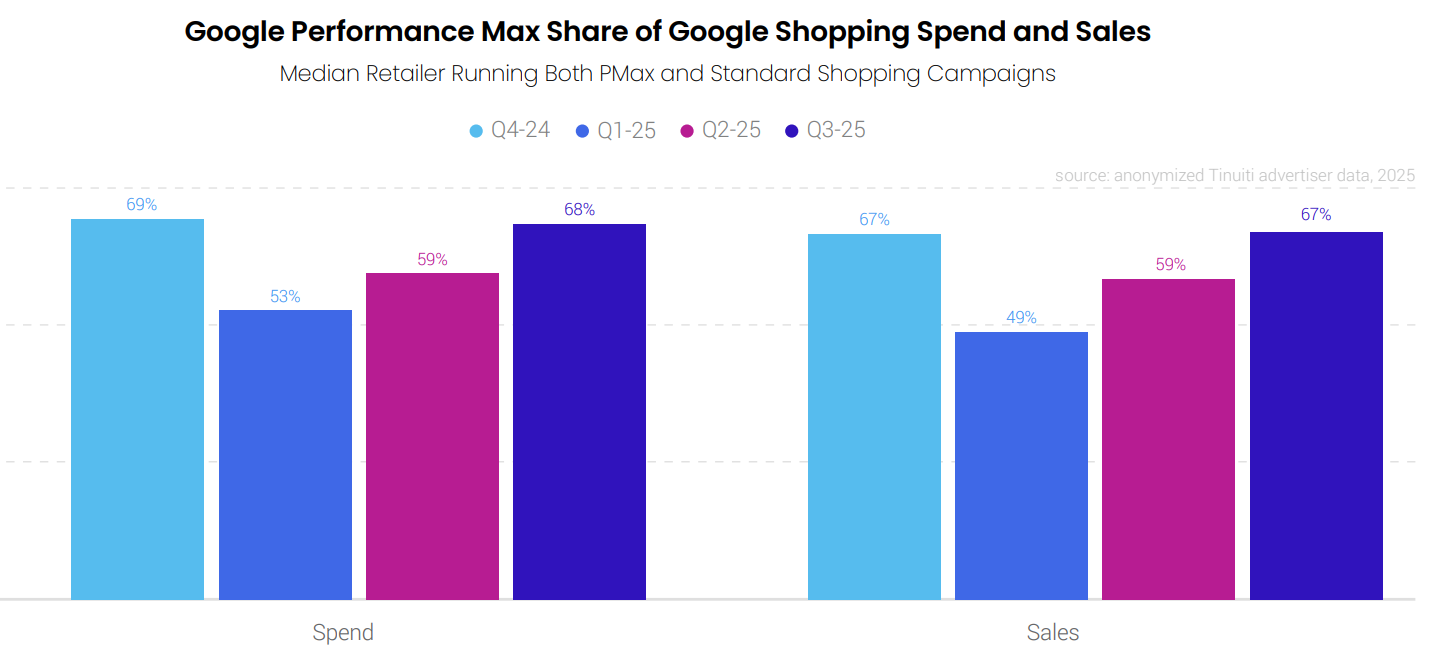
- In Q3 2025, Performance Max’s share of Google Shopping spending reached 68%, compared to 59% in Q2 and 53% in Q1.
- PMax accounted for 67% of all sales from Shopping ads in the third quarter.
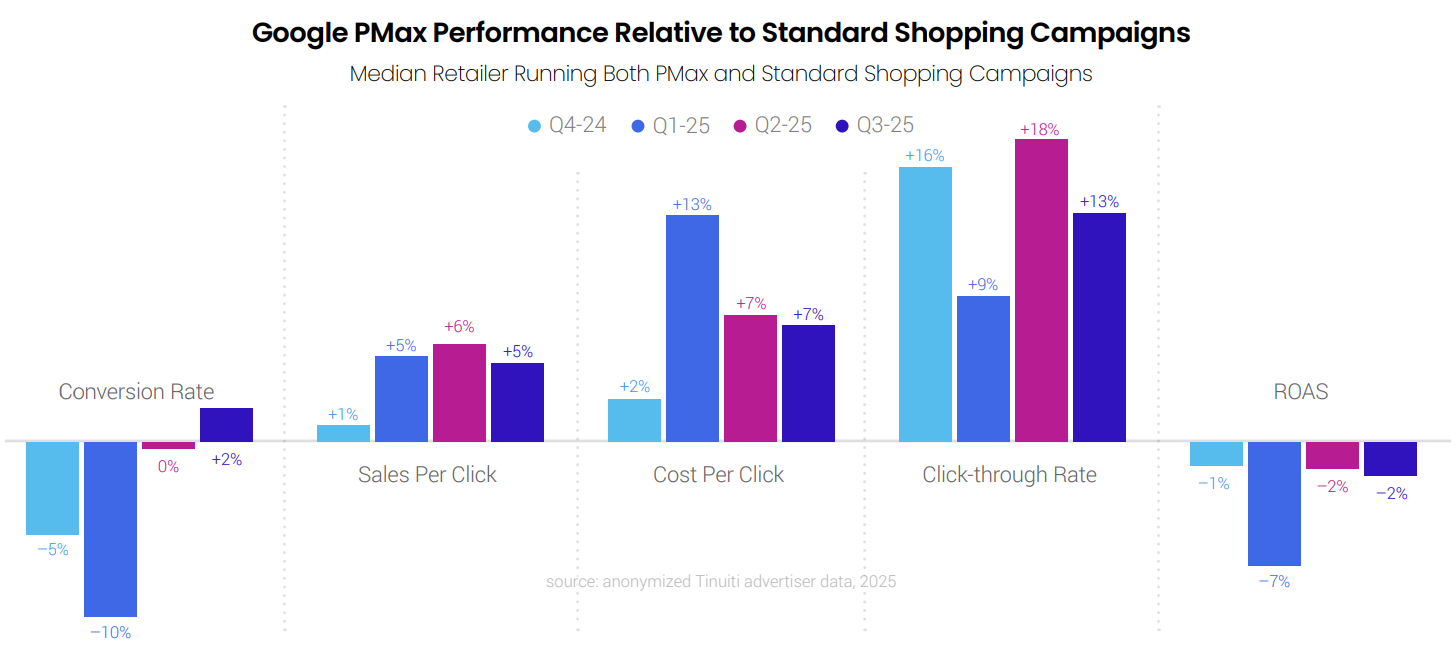
- In the third quarter of 2025, Performance Max showed a 2% higher result than standard Shopping campaigns. This is significant progress, considering that in the first quarter, PMax lagged behind by 10%.
- PMax delivered 5% more sales per click compared to standard Shopping, but because CPC was 7% higher, return on ad spend (ROAS) in PMax was 2% lower.
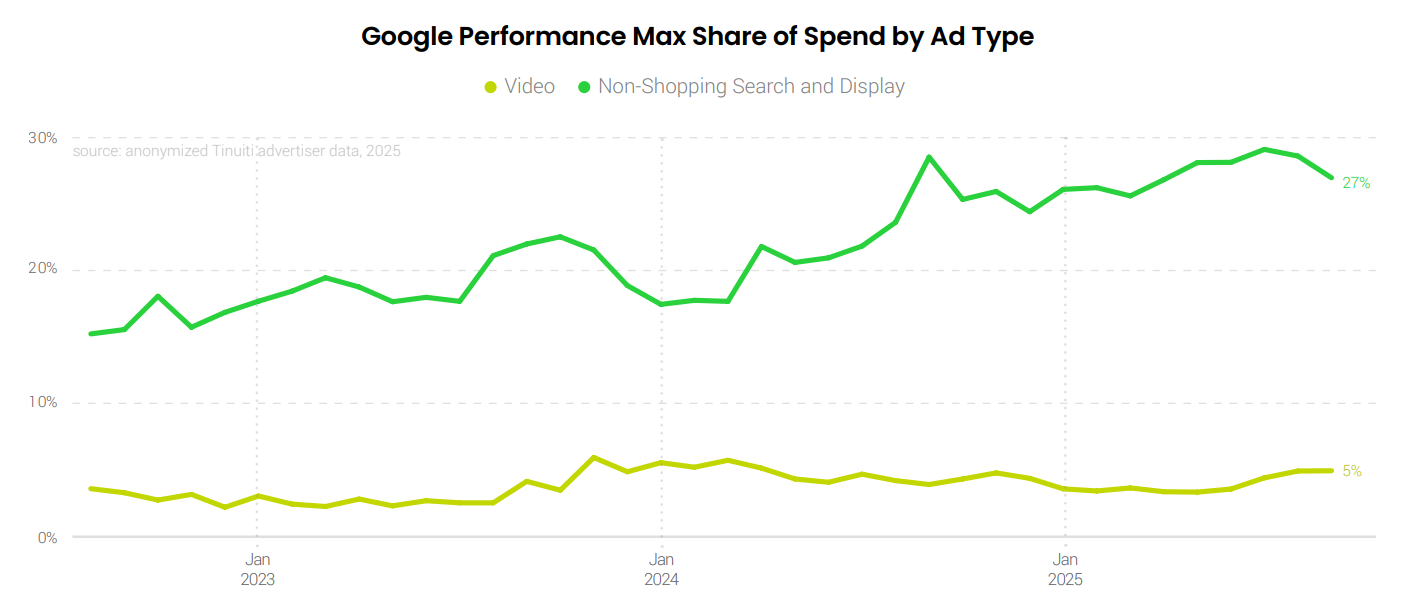
- By the end of the third quarter, non-shopping PMax campaigns accounted for 27% of spending among retail advertisers.
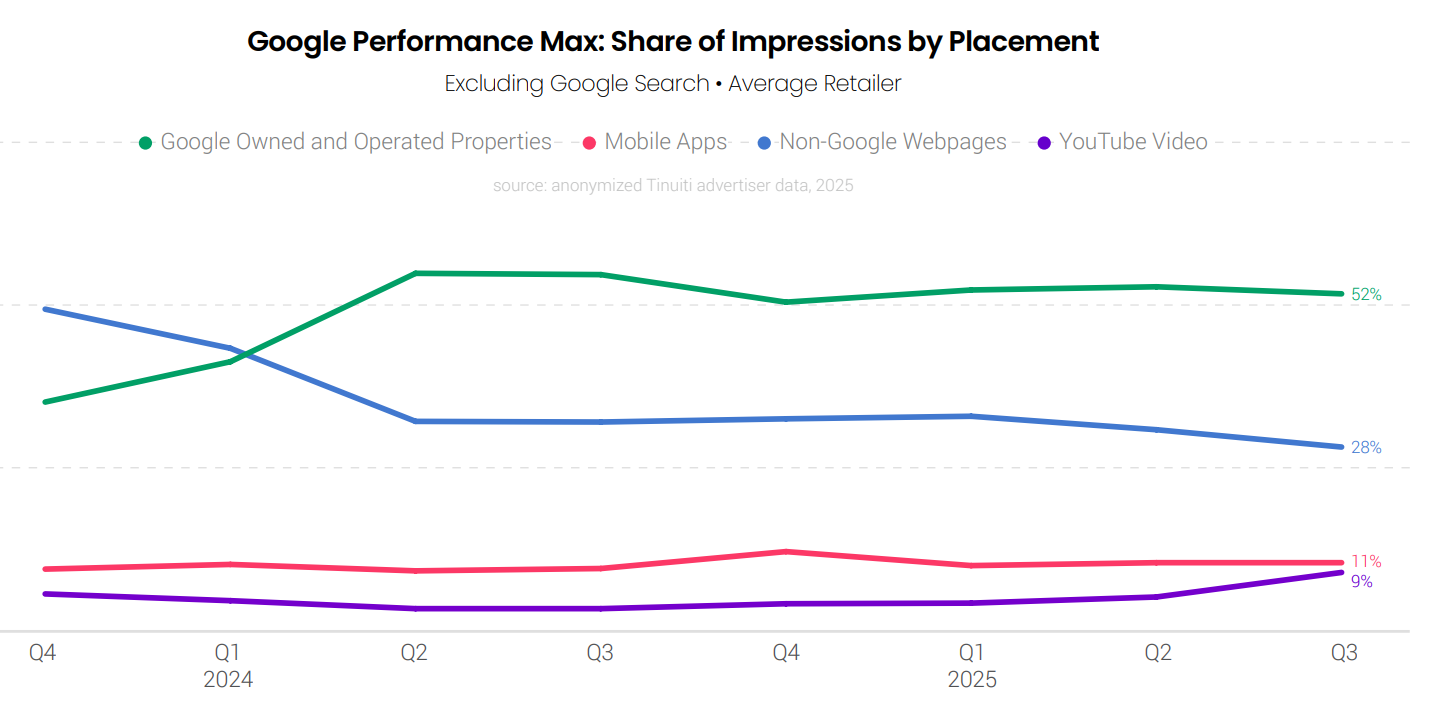
- The share of non-search PMax impressions attributable to YouTube videos increased from 5% in the second quarter to 9% in the third quarter of 2025.
- Most Performance Max placements continue to be generated by Google’s own and managed properties (Search, Shopping, Gmail, Discover, etc.).
- The share of impressions on non-Google web pages continues to decline. This trend has intensified since Google introduced the ability to exclude placements at the account level for the Search Partner Network — advertisers are actively using this feature to increase control over traffic.
Text ads
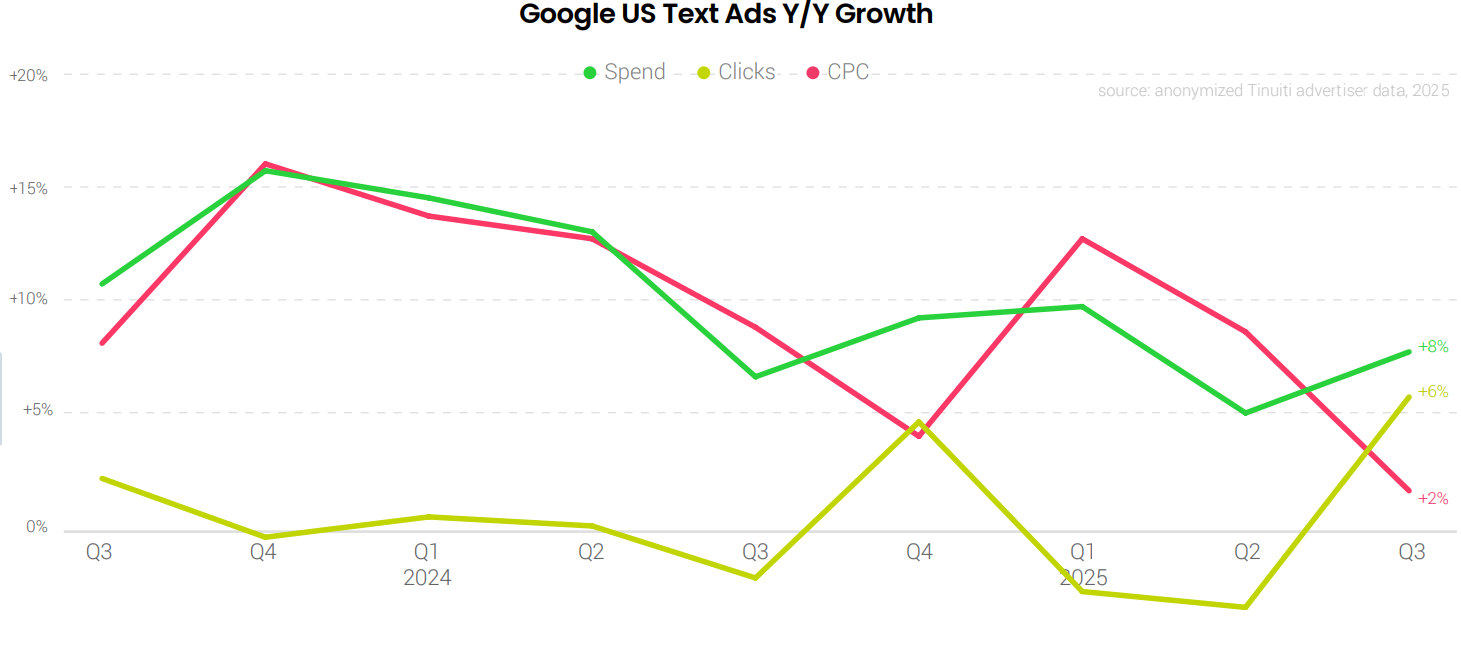
- Spending on text ads in search grew 8% year-over-year, which is higher than the 5% growth in the second quarter.
- For the first time since Q4 2024, there has been an increase in the number of clicks.
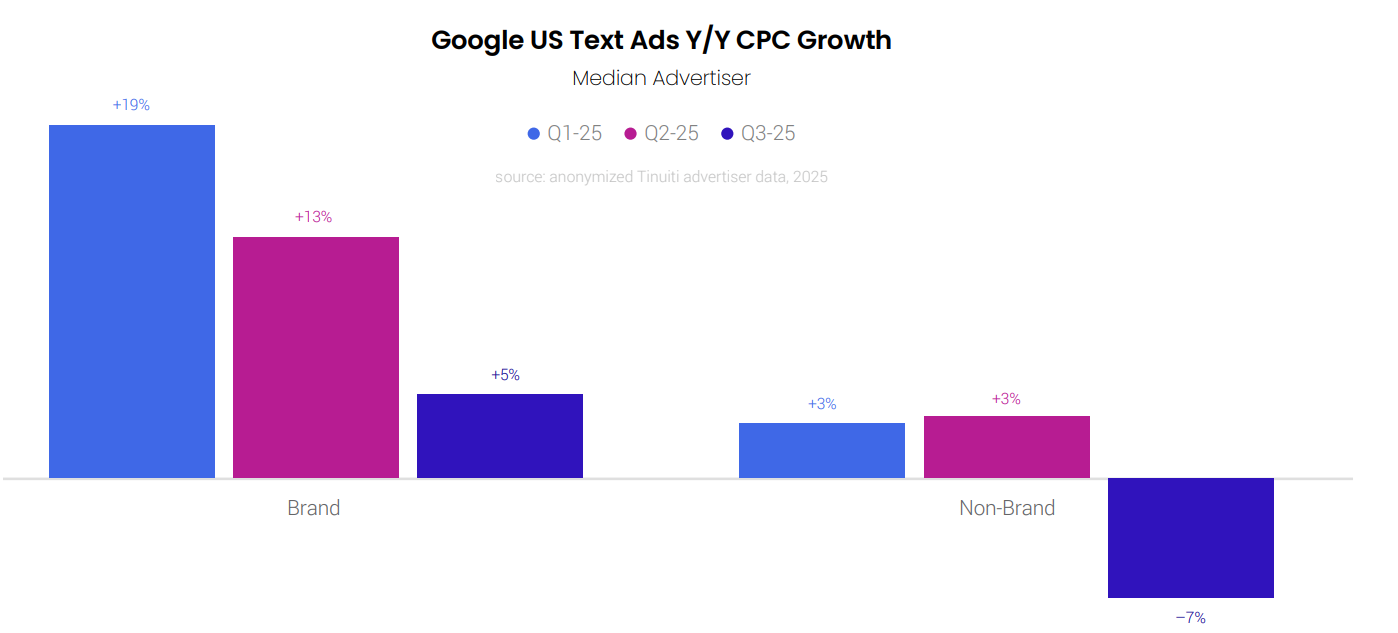
- CPC growth is slowing after a 13% peak in the first quarter due to the rising cost of branded keywords.
- AI Max campaigns are being tested as an add-on, but their contribution to overall growth is still minimal.
- After a sharp 19% year-on-year jump in the cost of brand clicks in the first quarter, growth slowed sharply: the decline continued in the second and third quarters, with growth of only 5% in Q3.
- For non-brand queries, CPC grew moderately at the beginning of the year (+3% in Q1 and Q2), but declined by 7% in the third quarter.
Video and Display Network
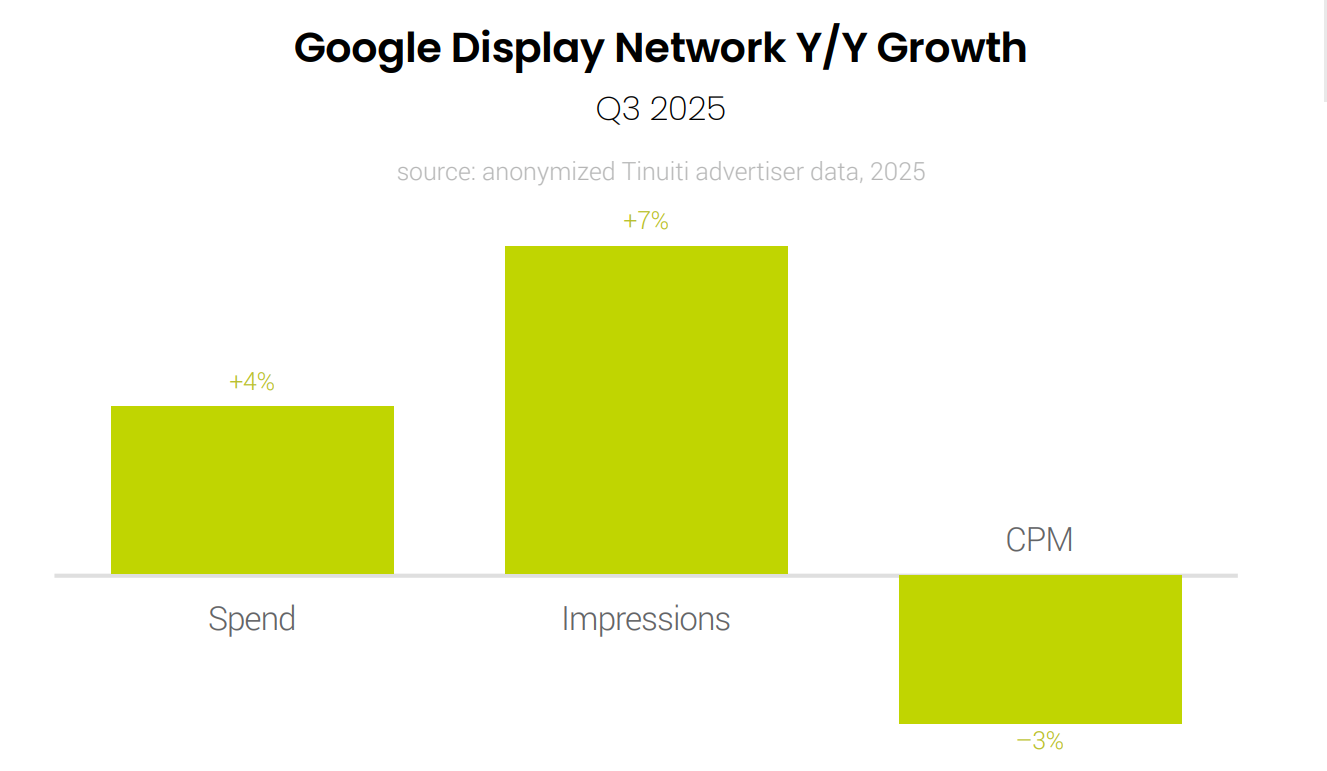
- GDN spending (including display campaigns, apps, Demand Gen, video, and other formats) grew 4% year-on-year, down from 6% in the second quarter.
- Impressions: +7% year-on-year. Average CPM: -3% year-on-year.
- Google’s ‘other’ advertising revenue segment (excluding search and YouTube) has seen a decline in revenue for 12 consecutive quarters.
- More details Tinuiti Digital Ads Benchmark.