ADCostly provides in-depth and categorized information on the Facebook Ads cost indicators, broken down by 27 countries. We’ve analyzed the data and highlighted core indicators in 2021 and Q4 2021.
2021 Overall Facebook Ads Statistics
Here’s data on all ad categories in 2021.
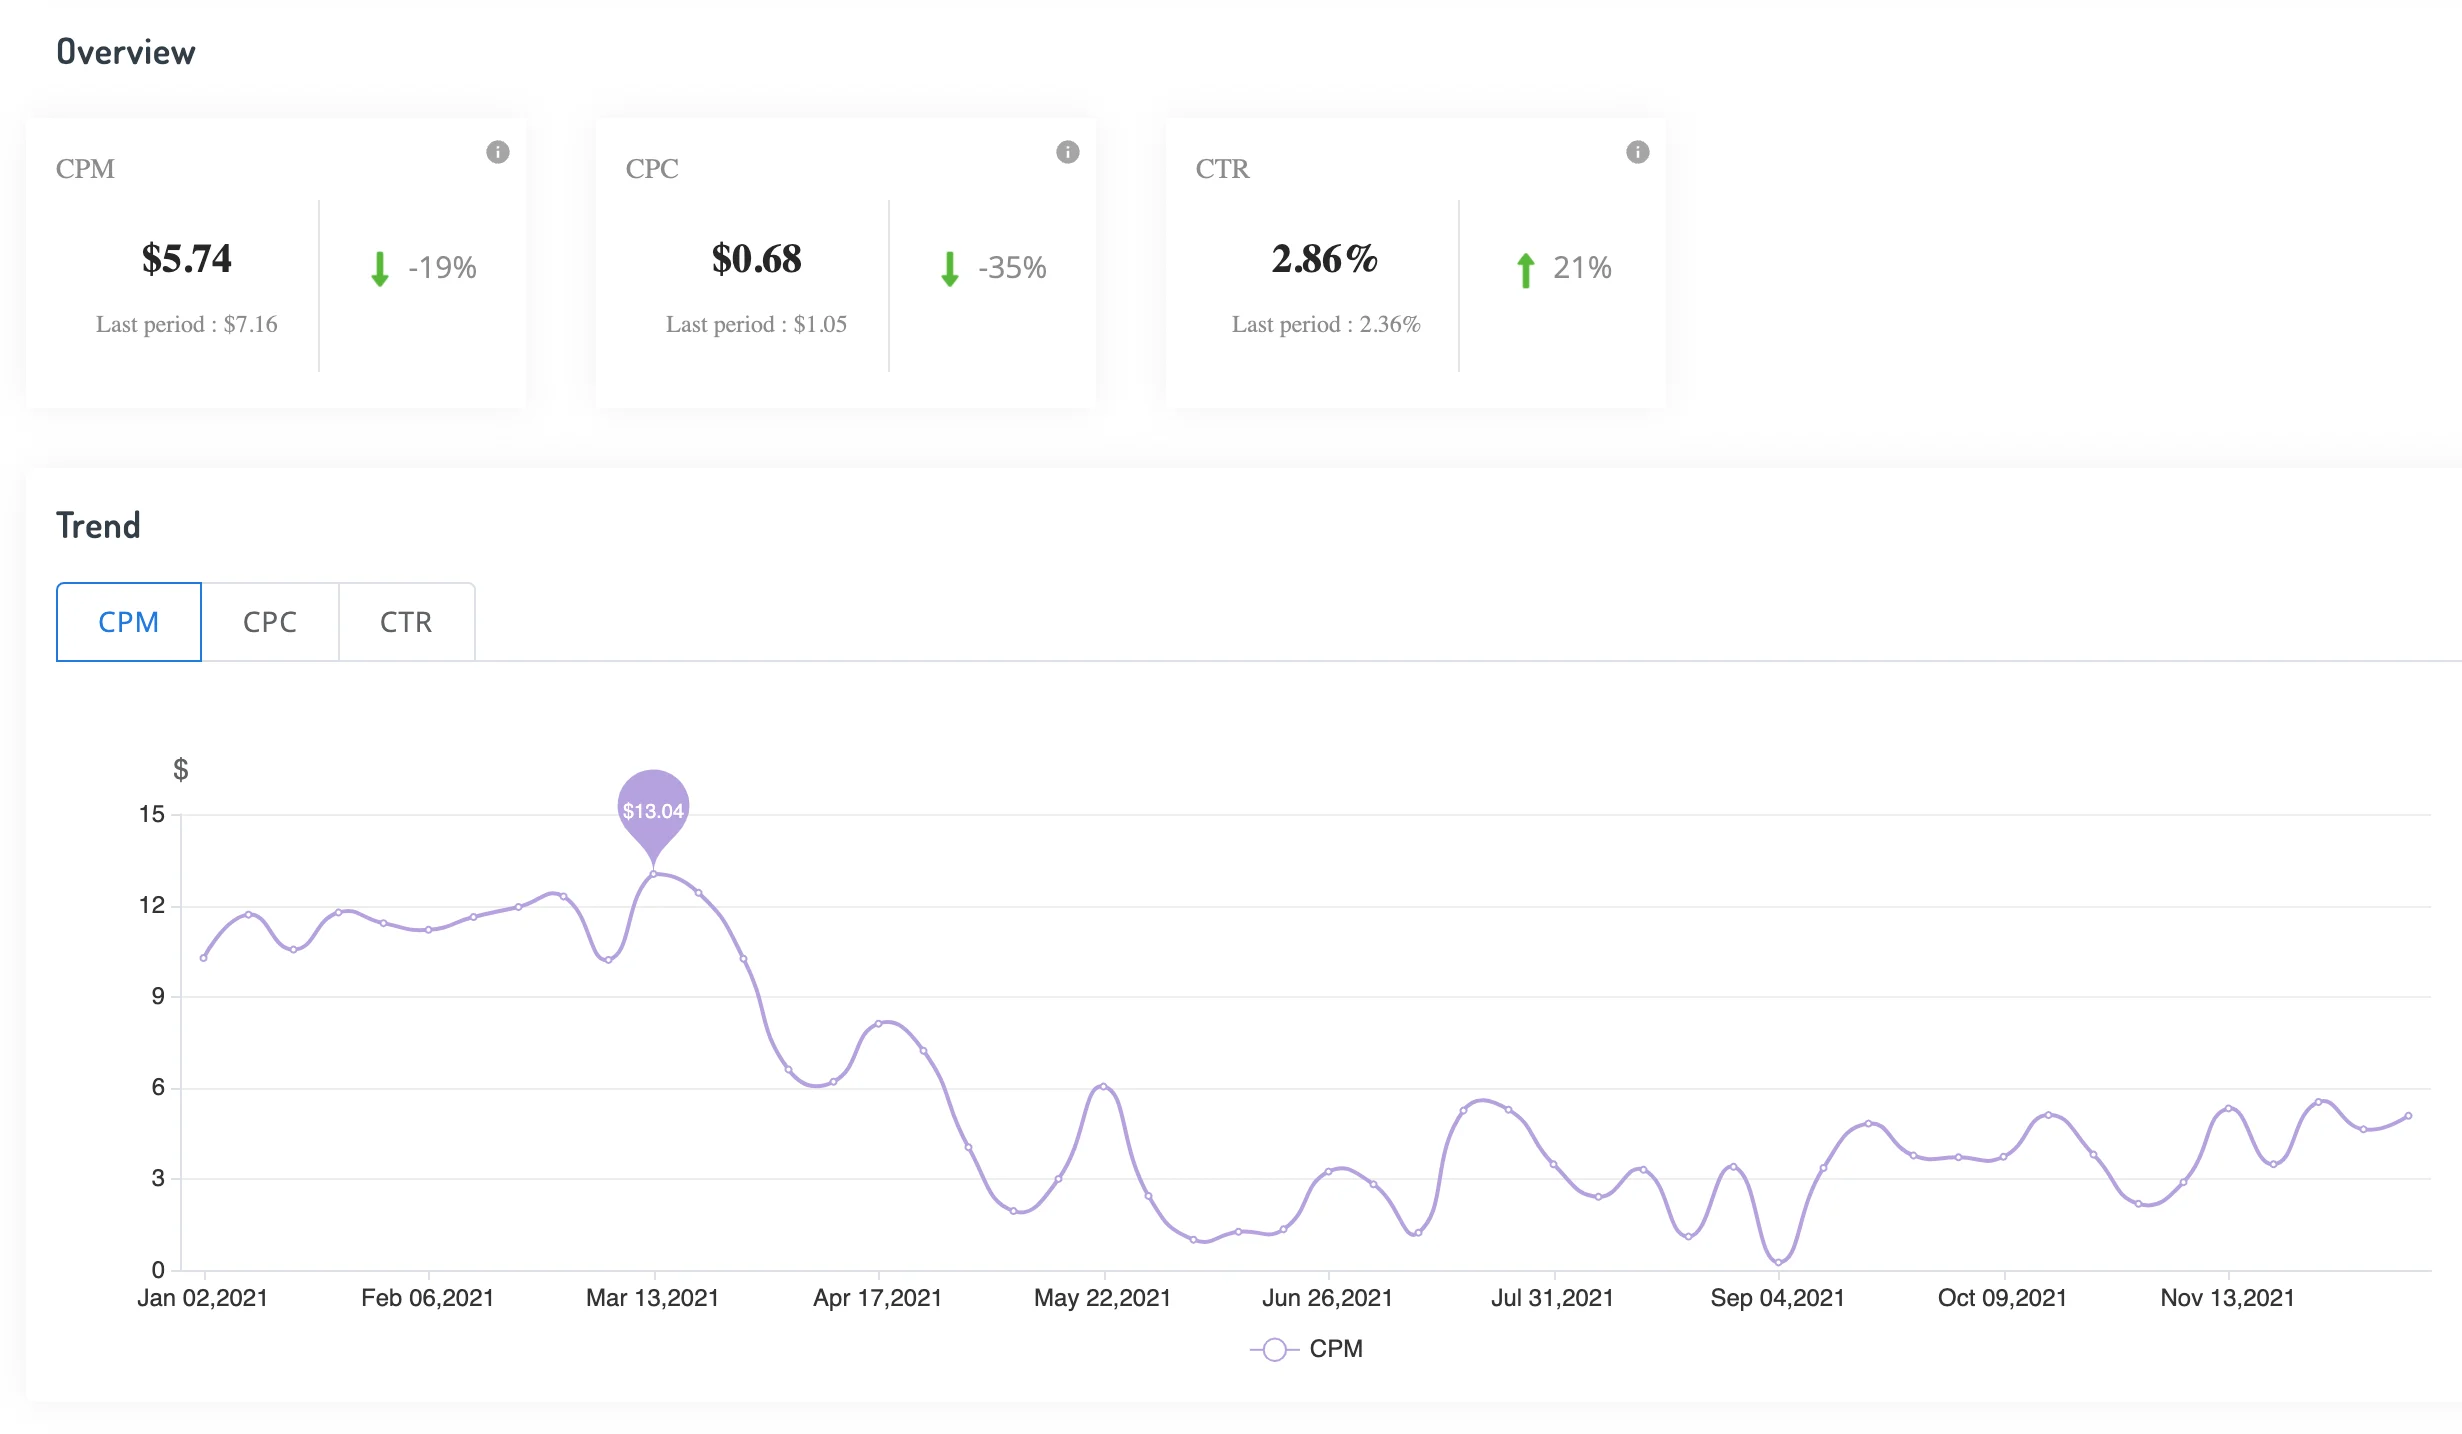
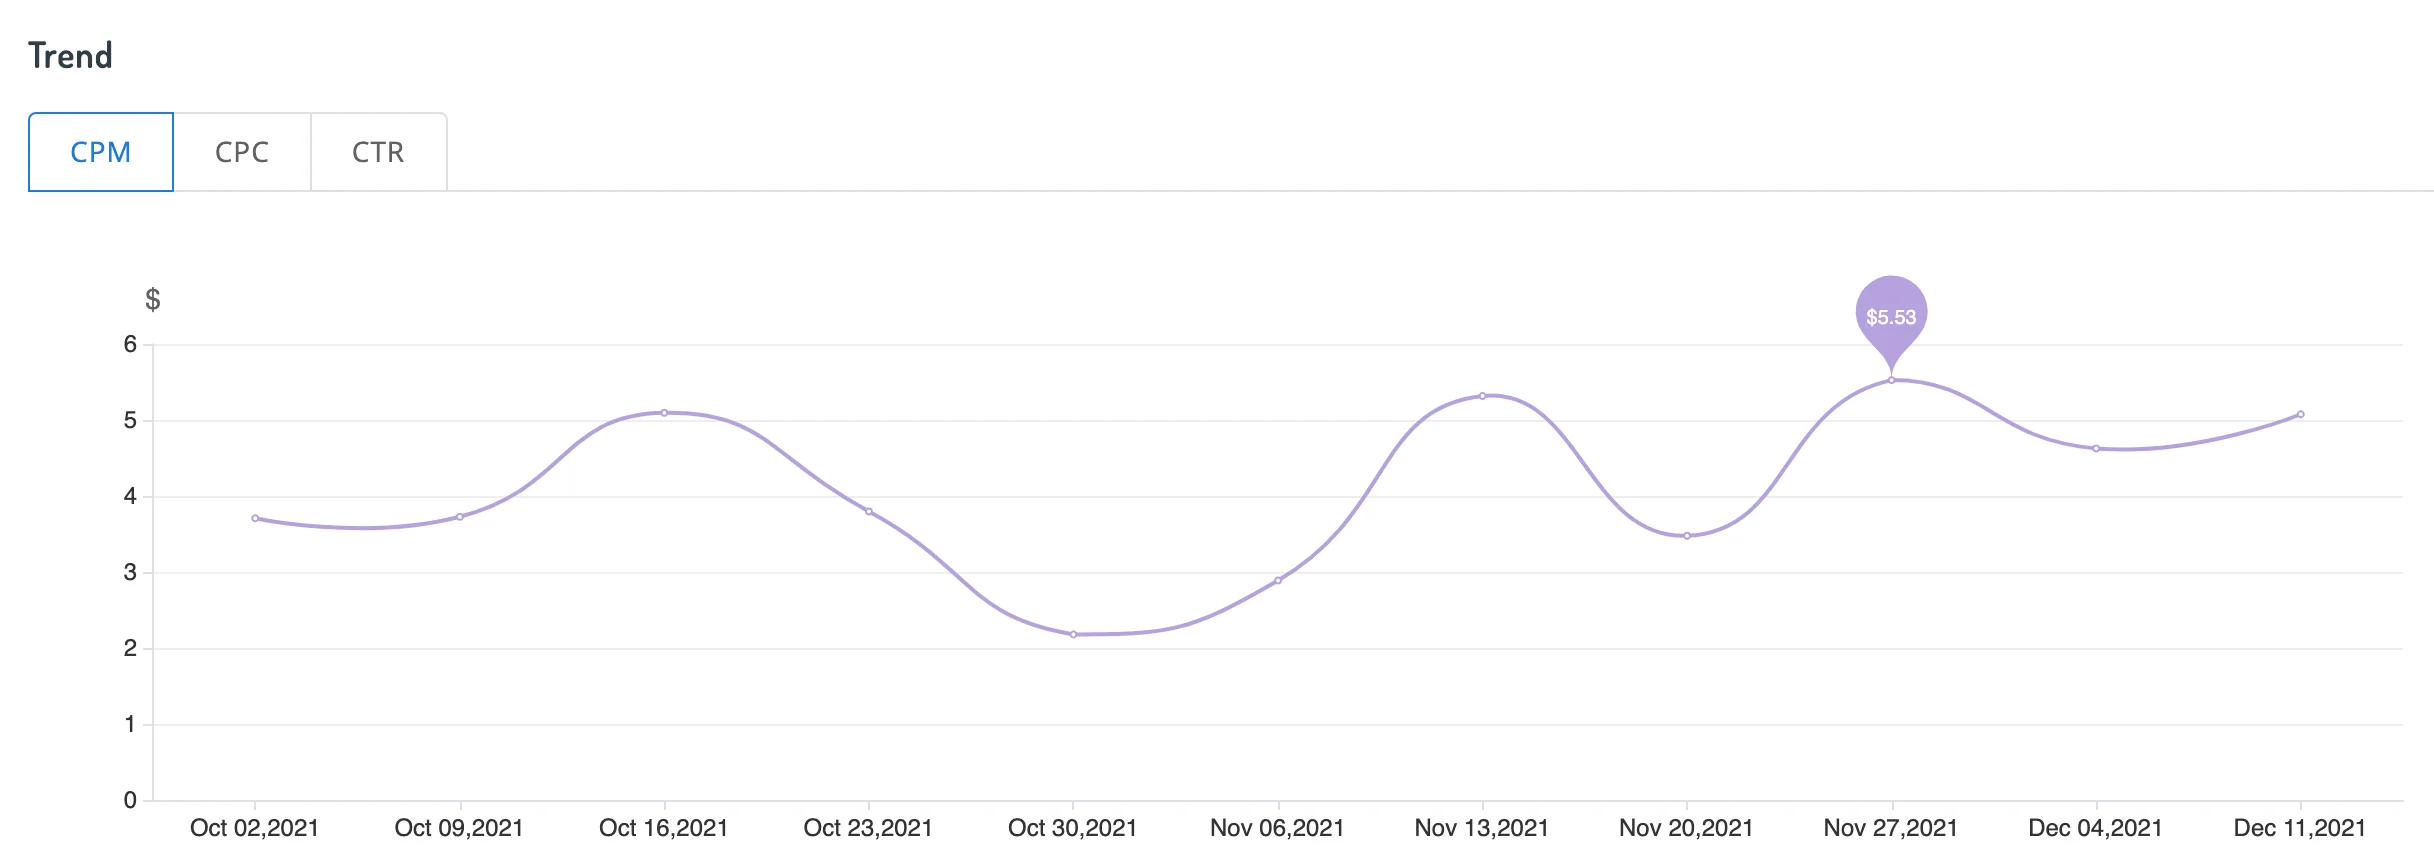
2021 CPM Dynamics
As you can see from the graph, the average CPM was the highest from January to March, reaching $13.04. Then it dropped down and reached its lowest in June. Beginning in October – November it started to grow again.
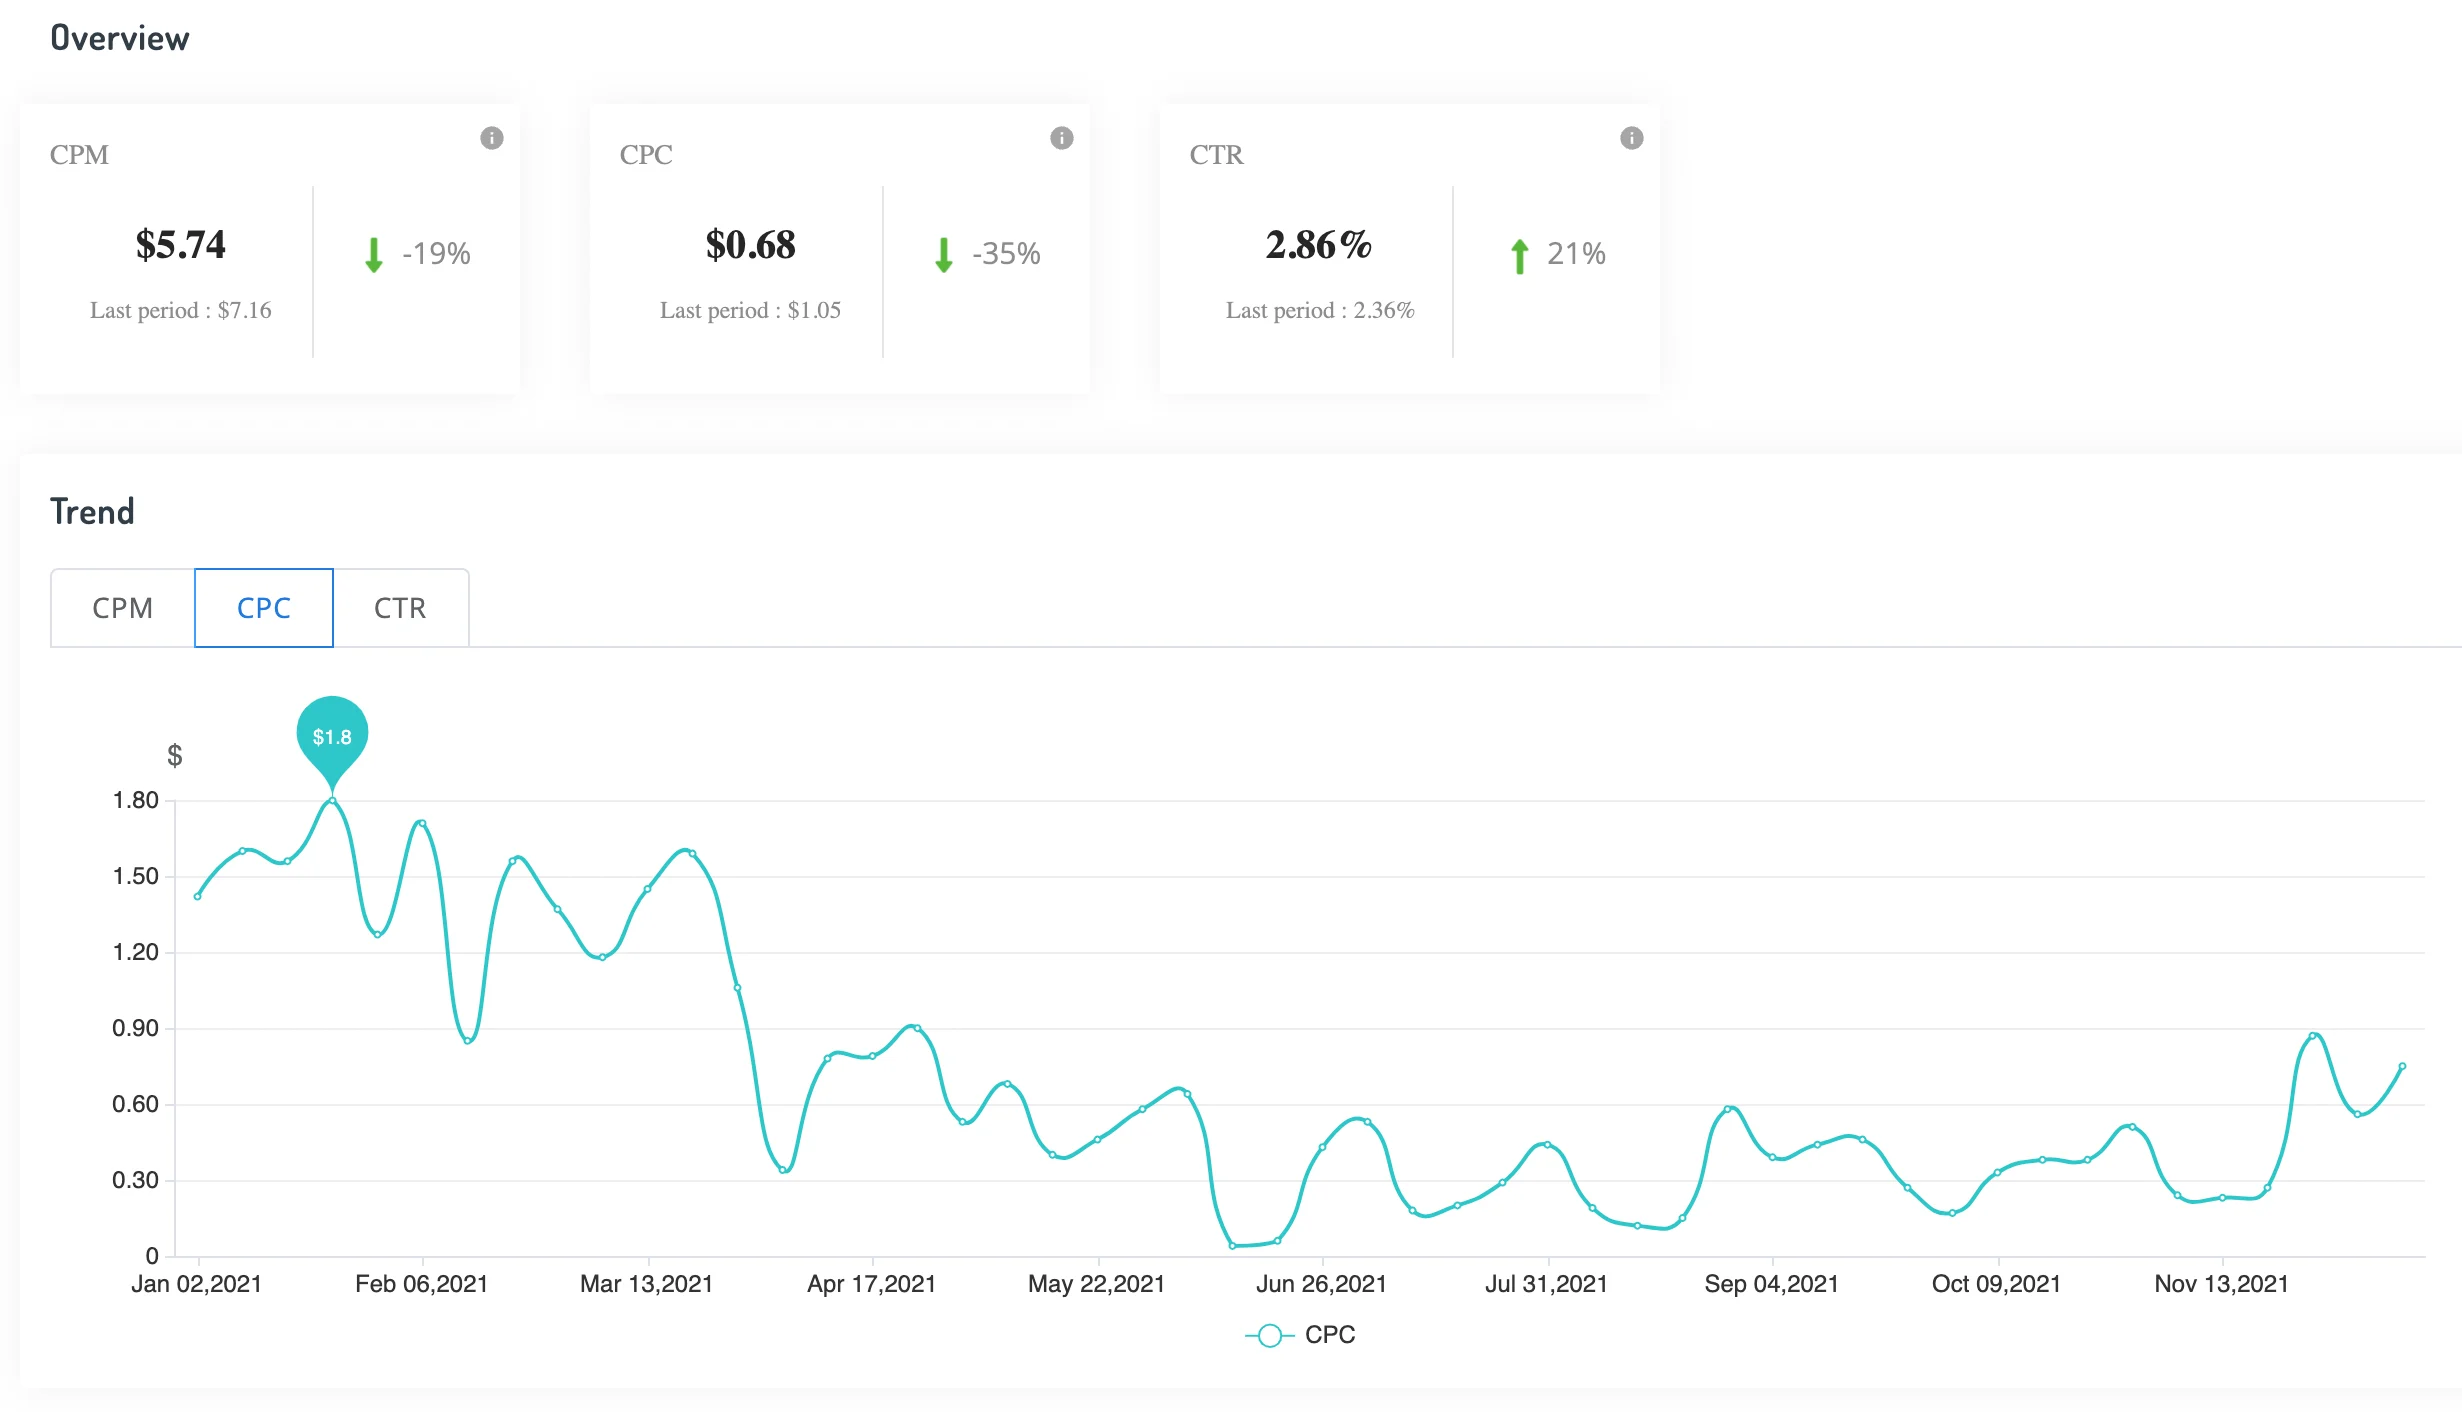
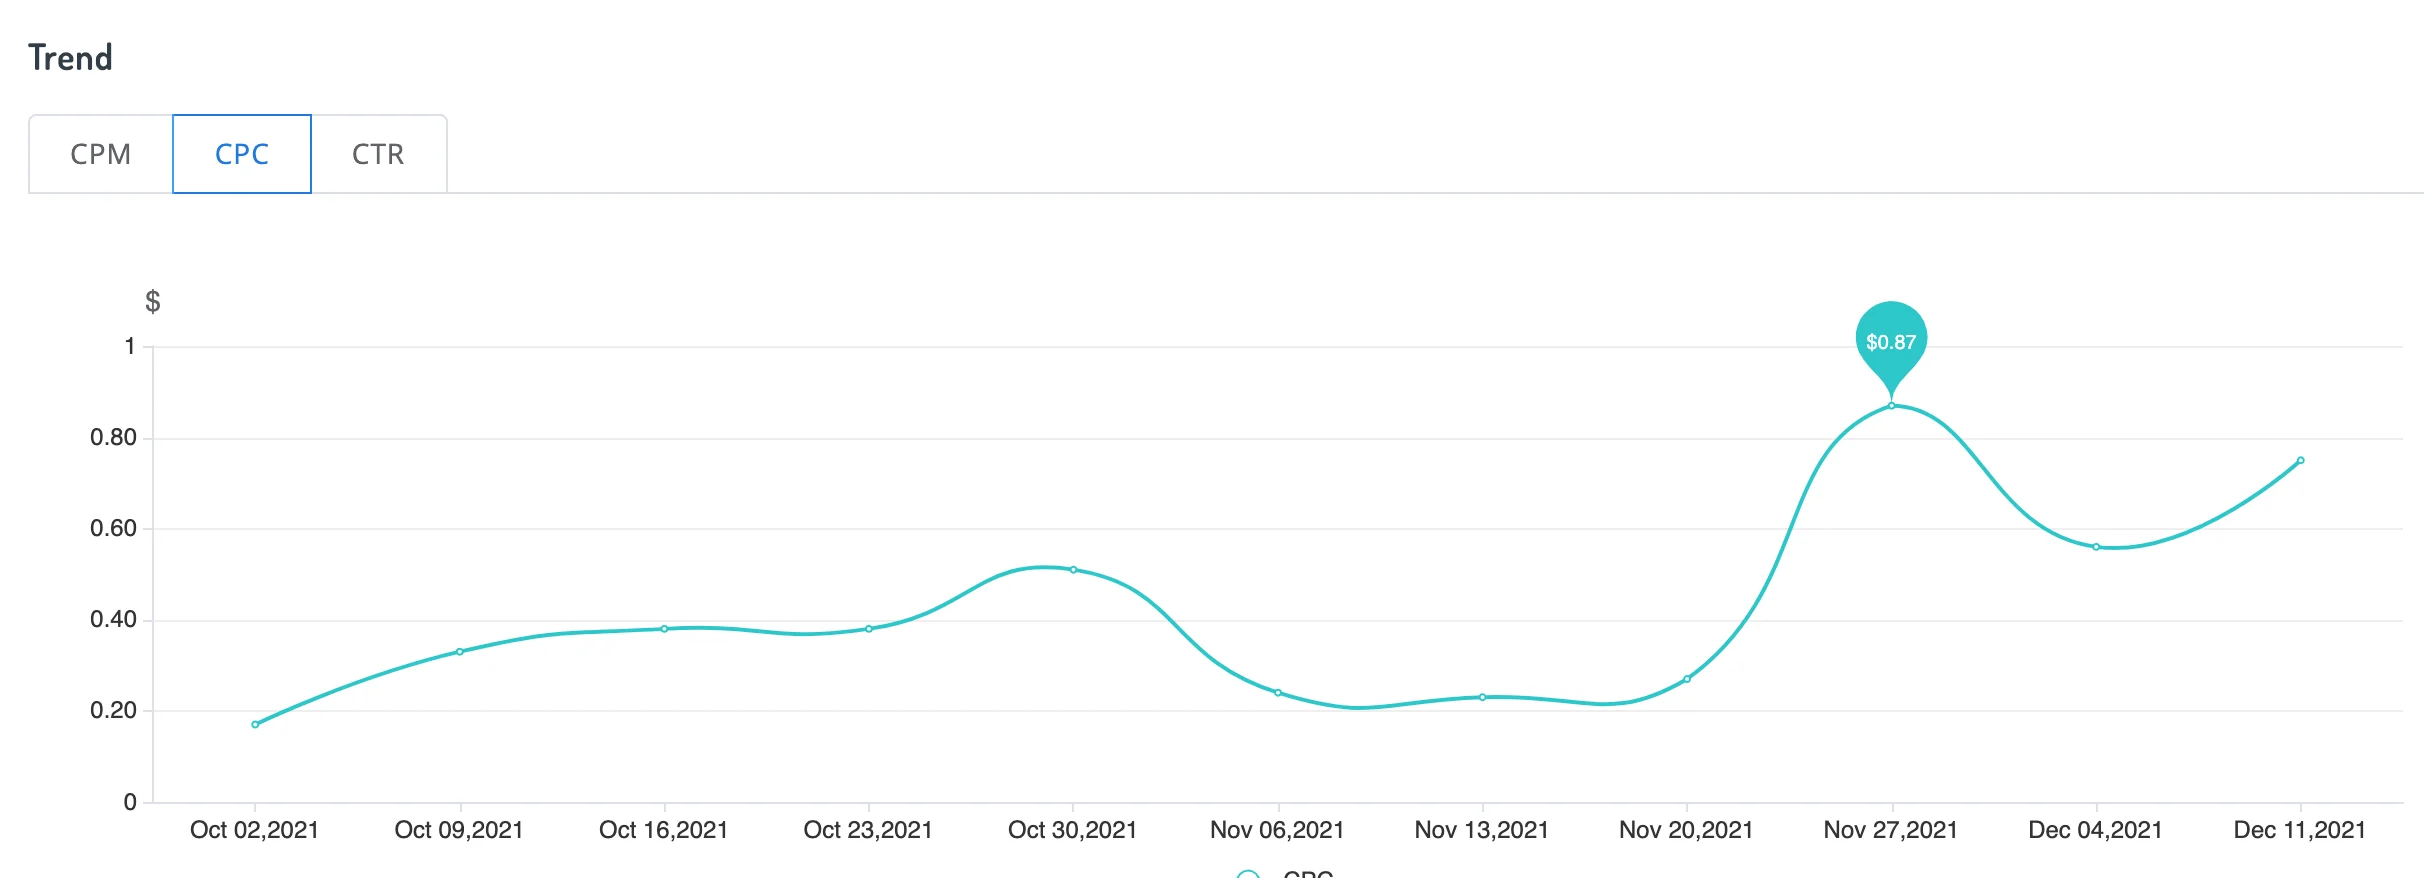
2021 CPC Dynamics
The CPC trend is similar. The maximum average CPC was $1.8.
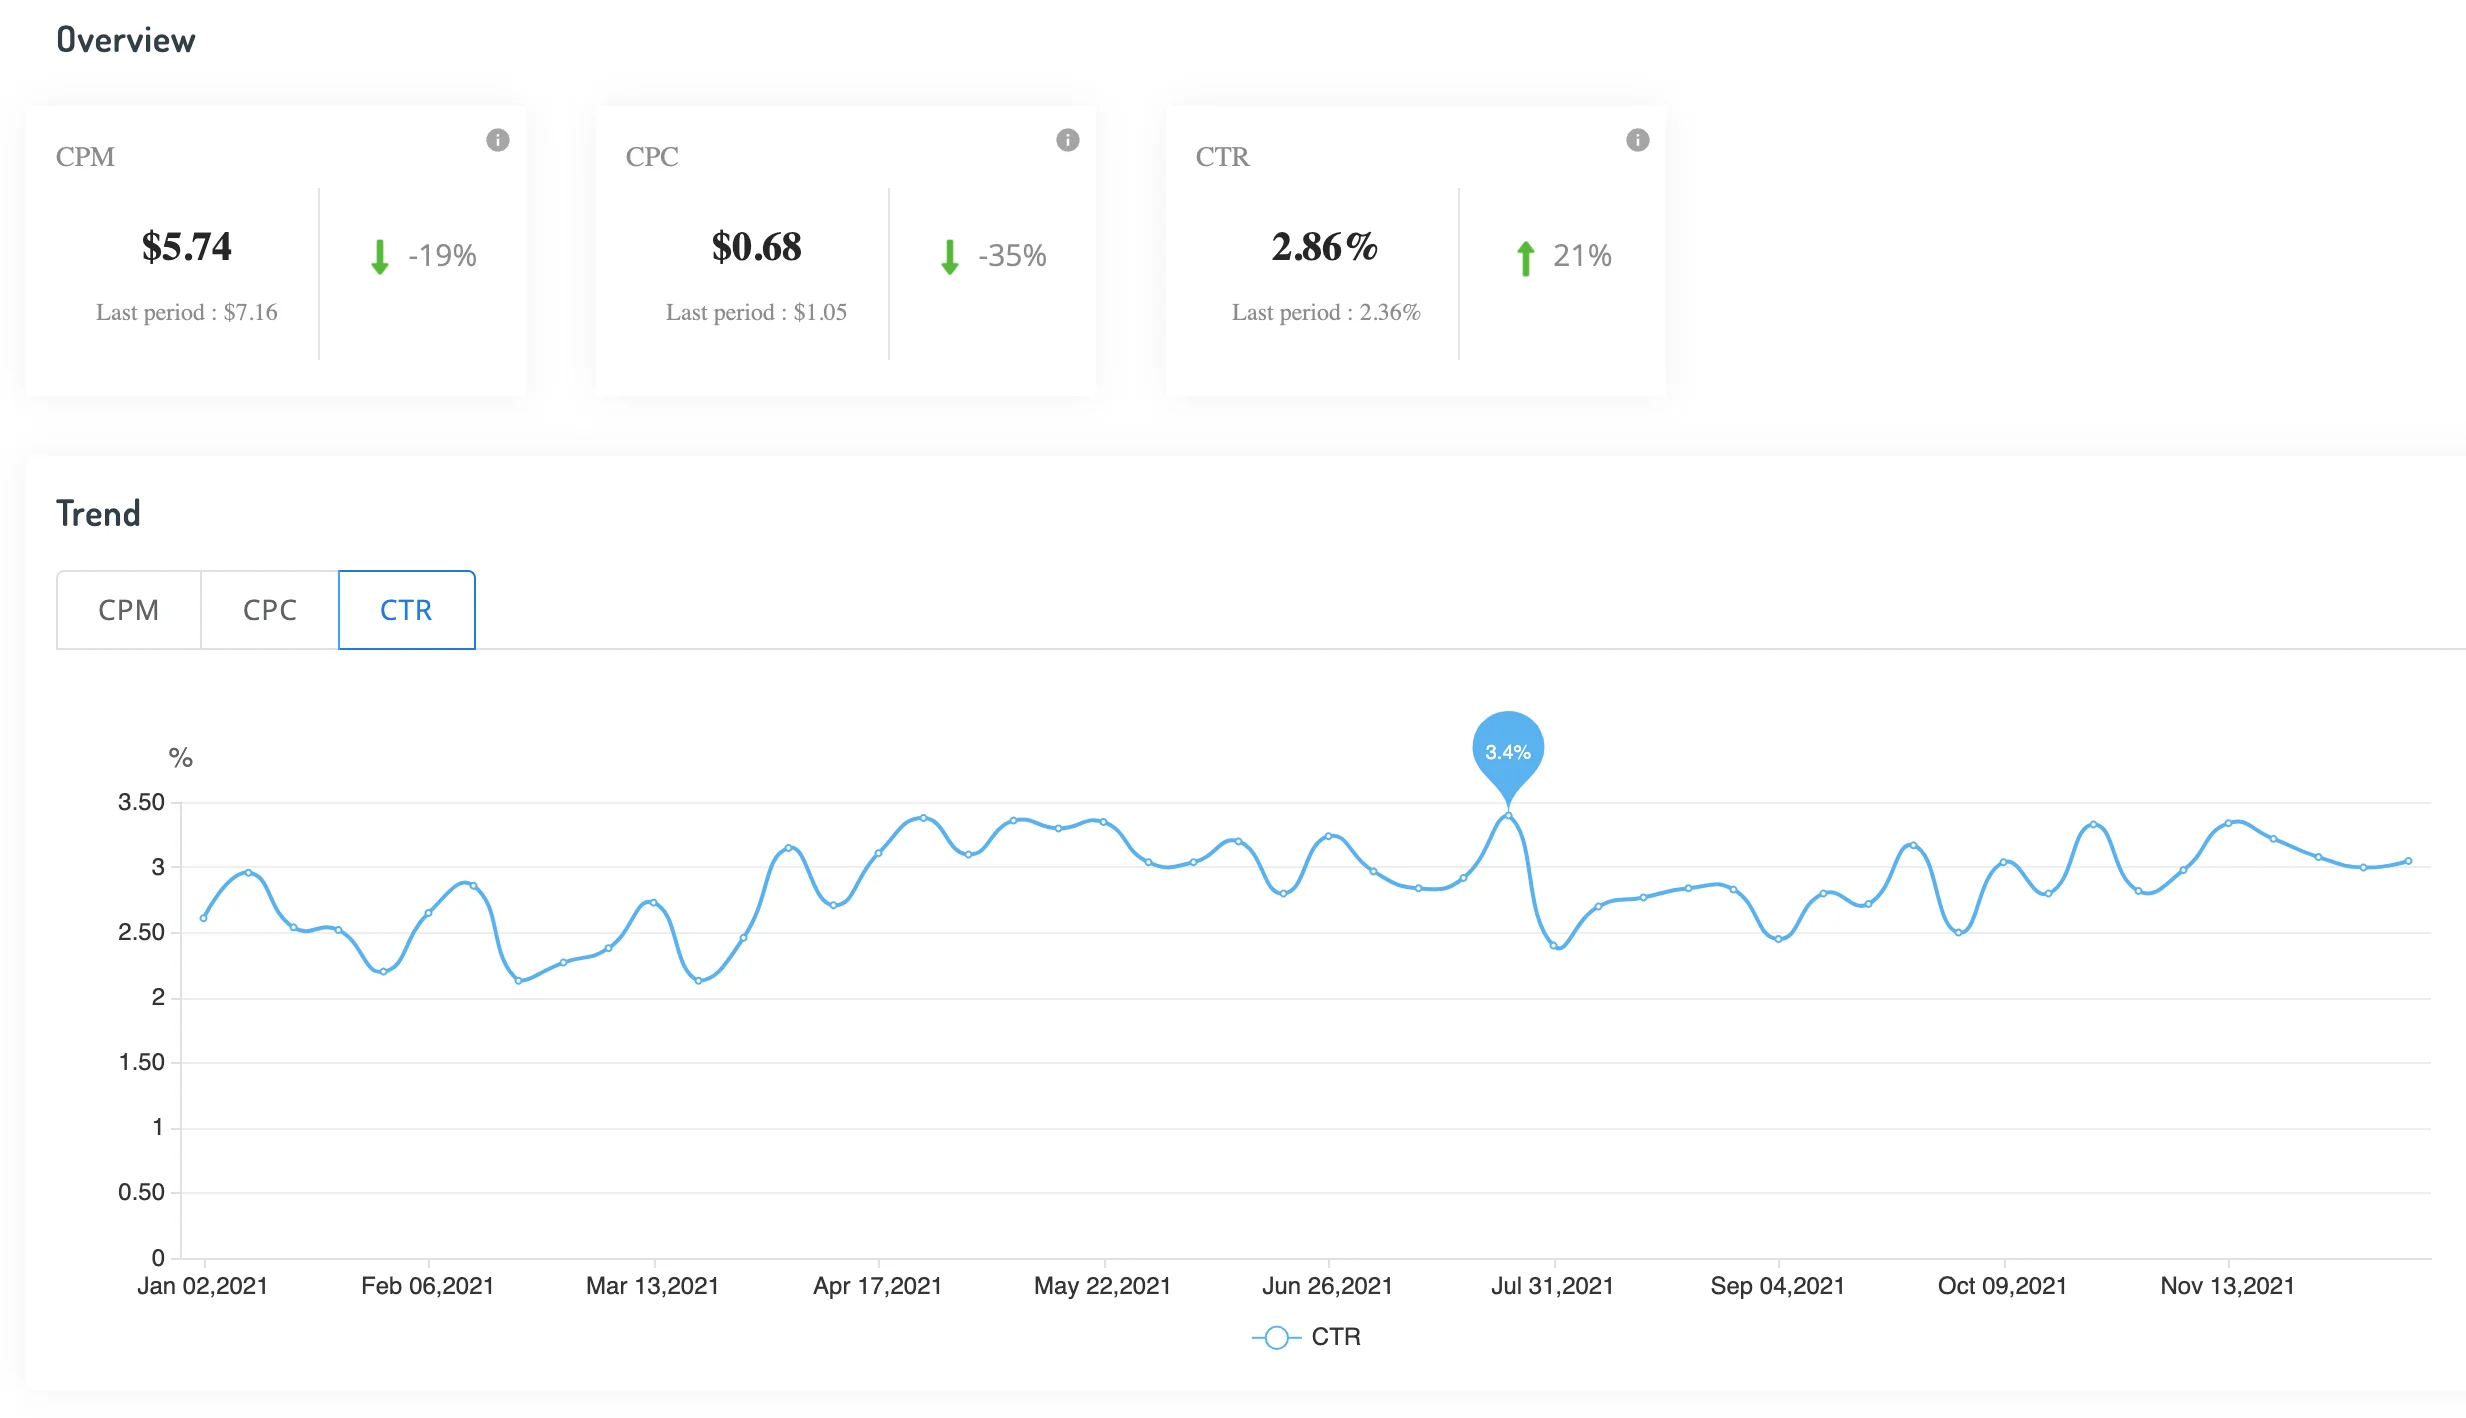
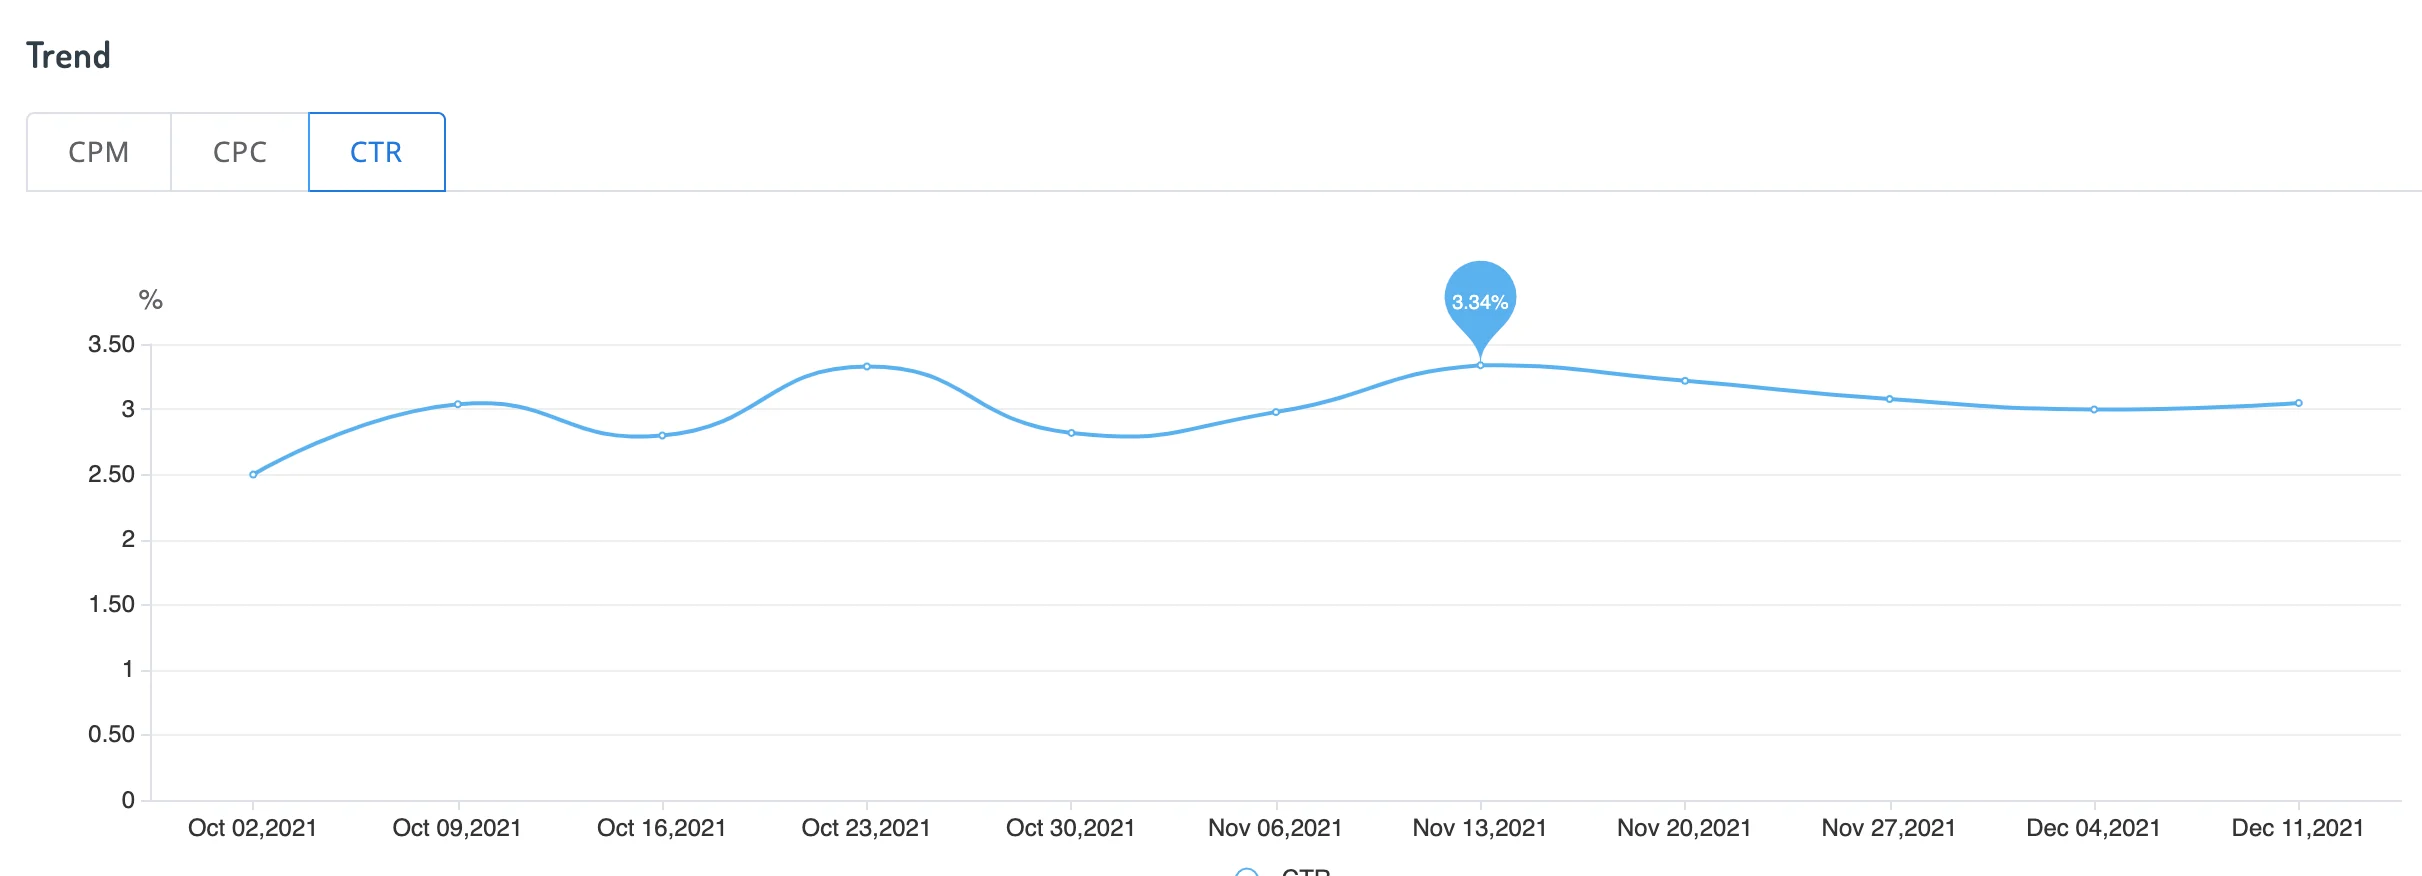
2021 CTR Dynamics
There is a correlation between CPM and CTR / CTR, but overall dynamics are rising.
Average CPM, CPC, and CTR by Country in 2021
Let’s consider indicators by GEO. Affluent countries demonstrate the maximum values in cost per click and cost per mile indicators as expected.
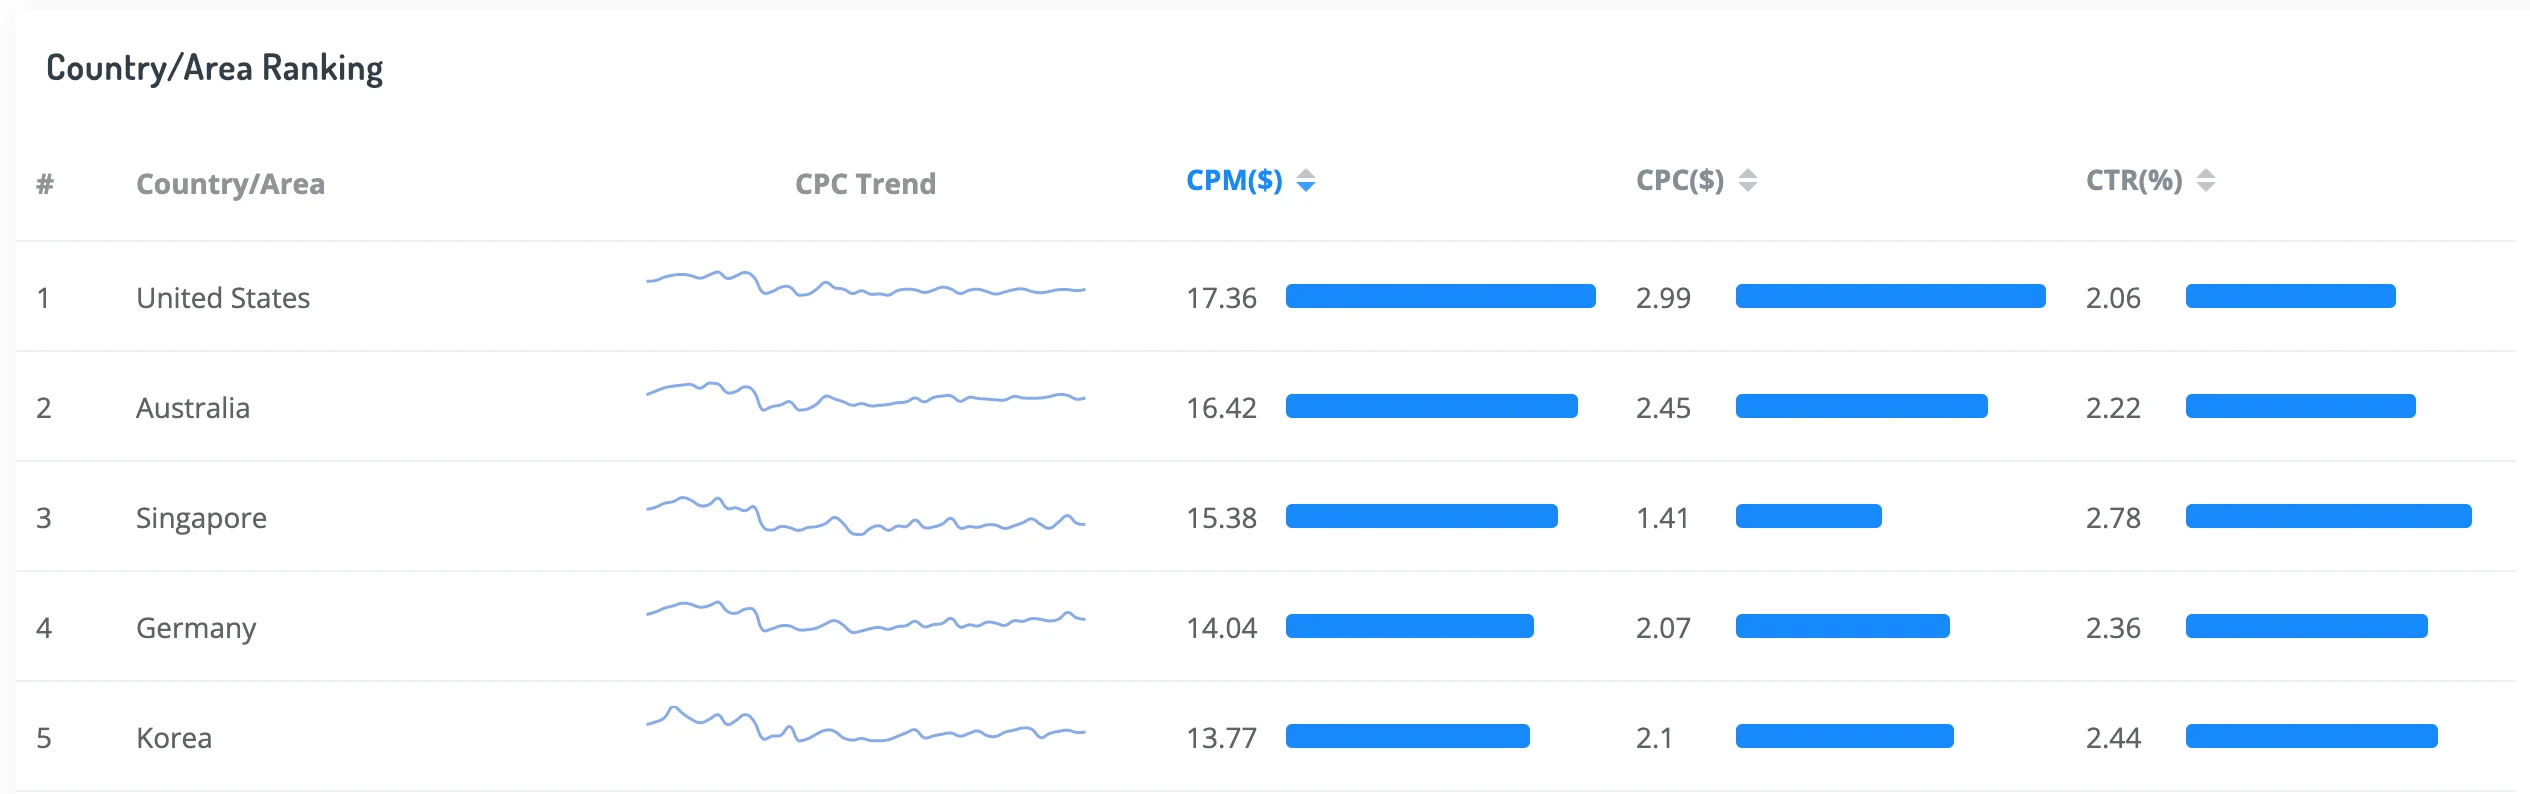
Top 5 Countries by CPM
The U.S. is on top.
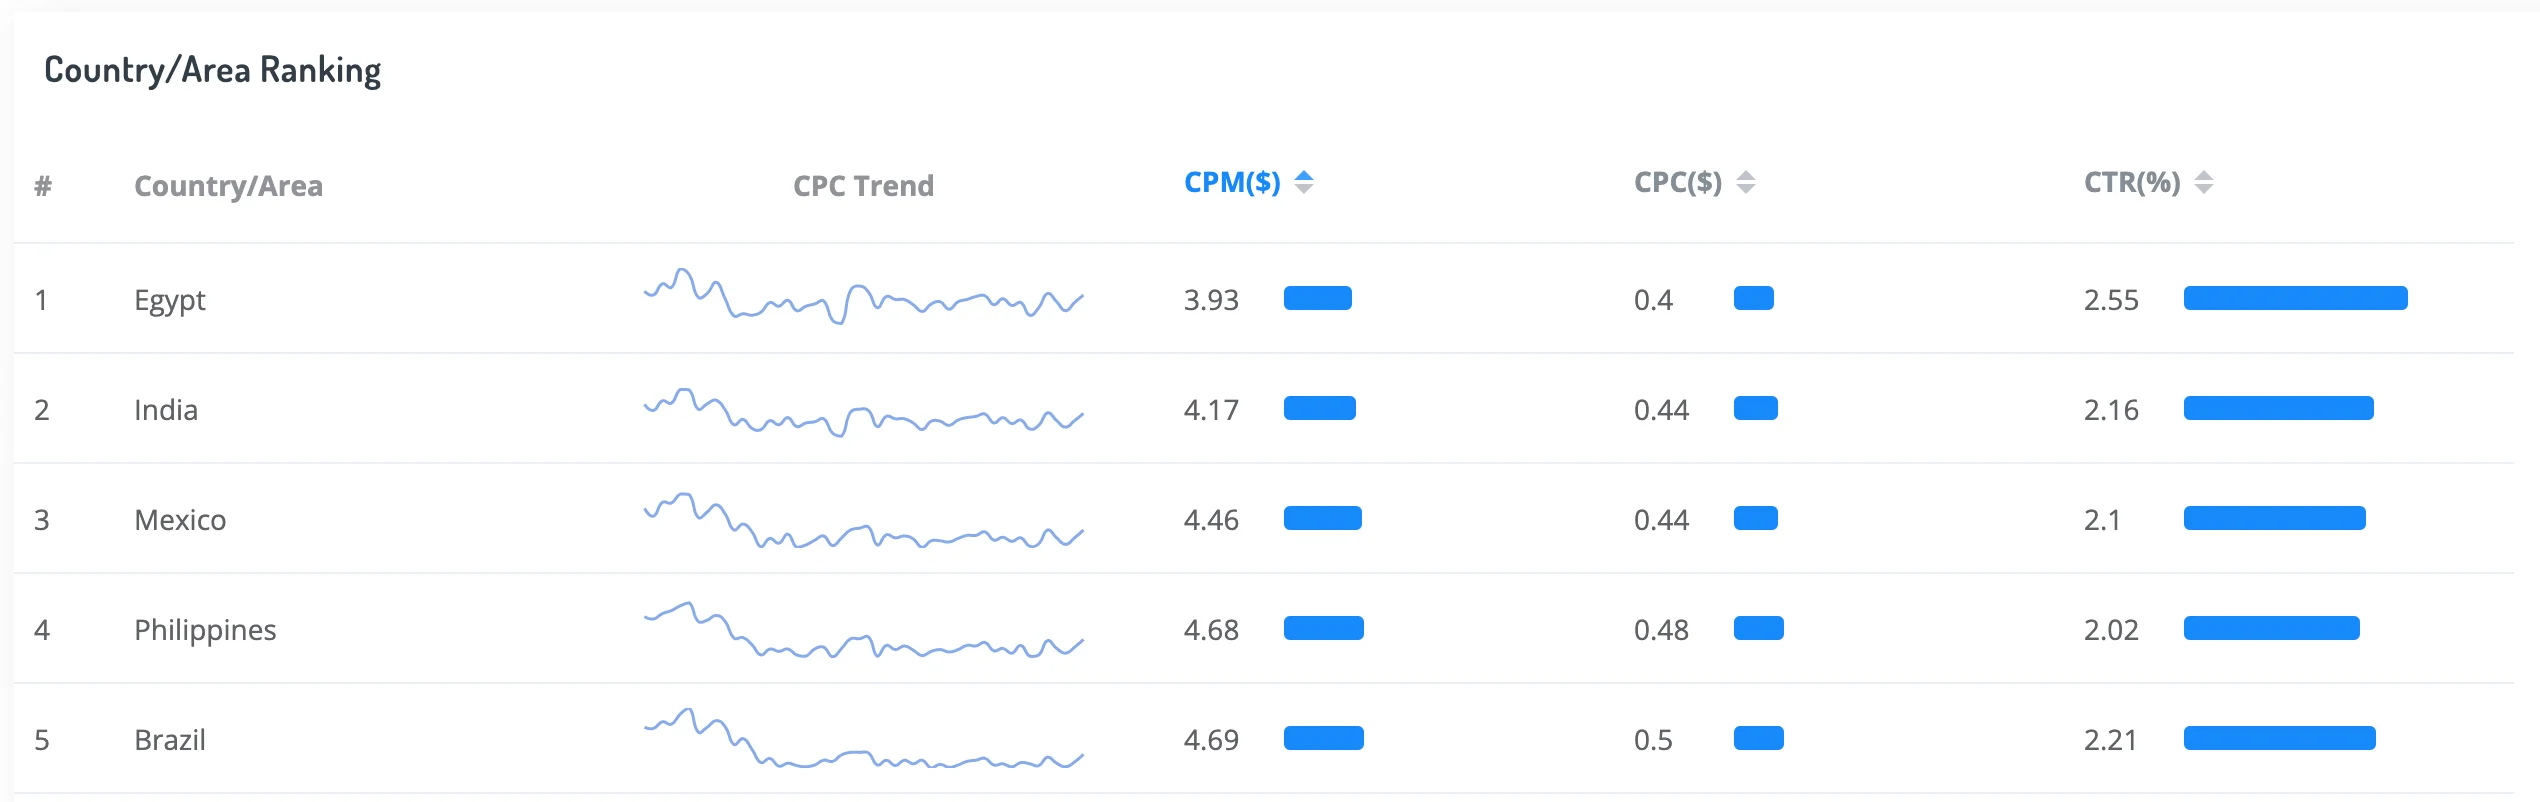
Egypt is topping the lowest CPM, followed by India, Mexico, the Philippines, and Brazil.
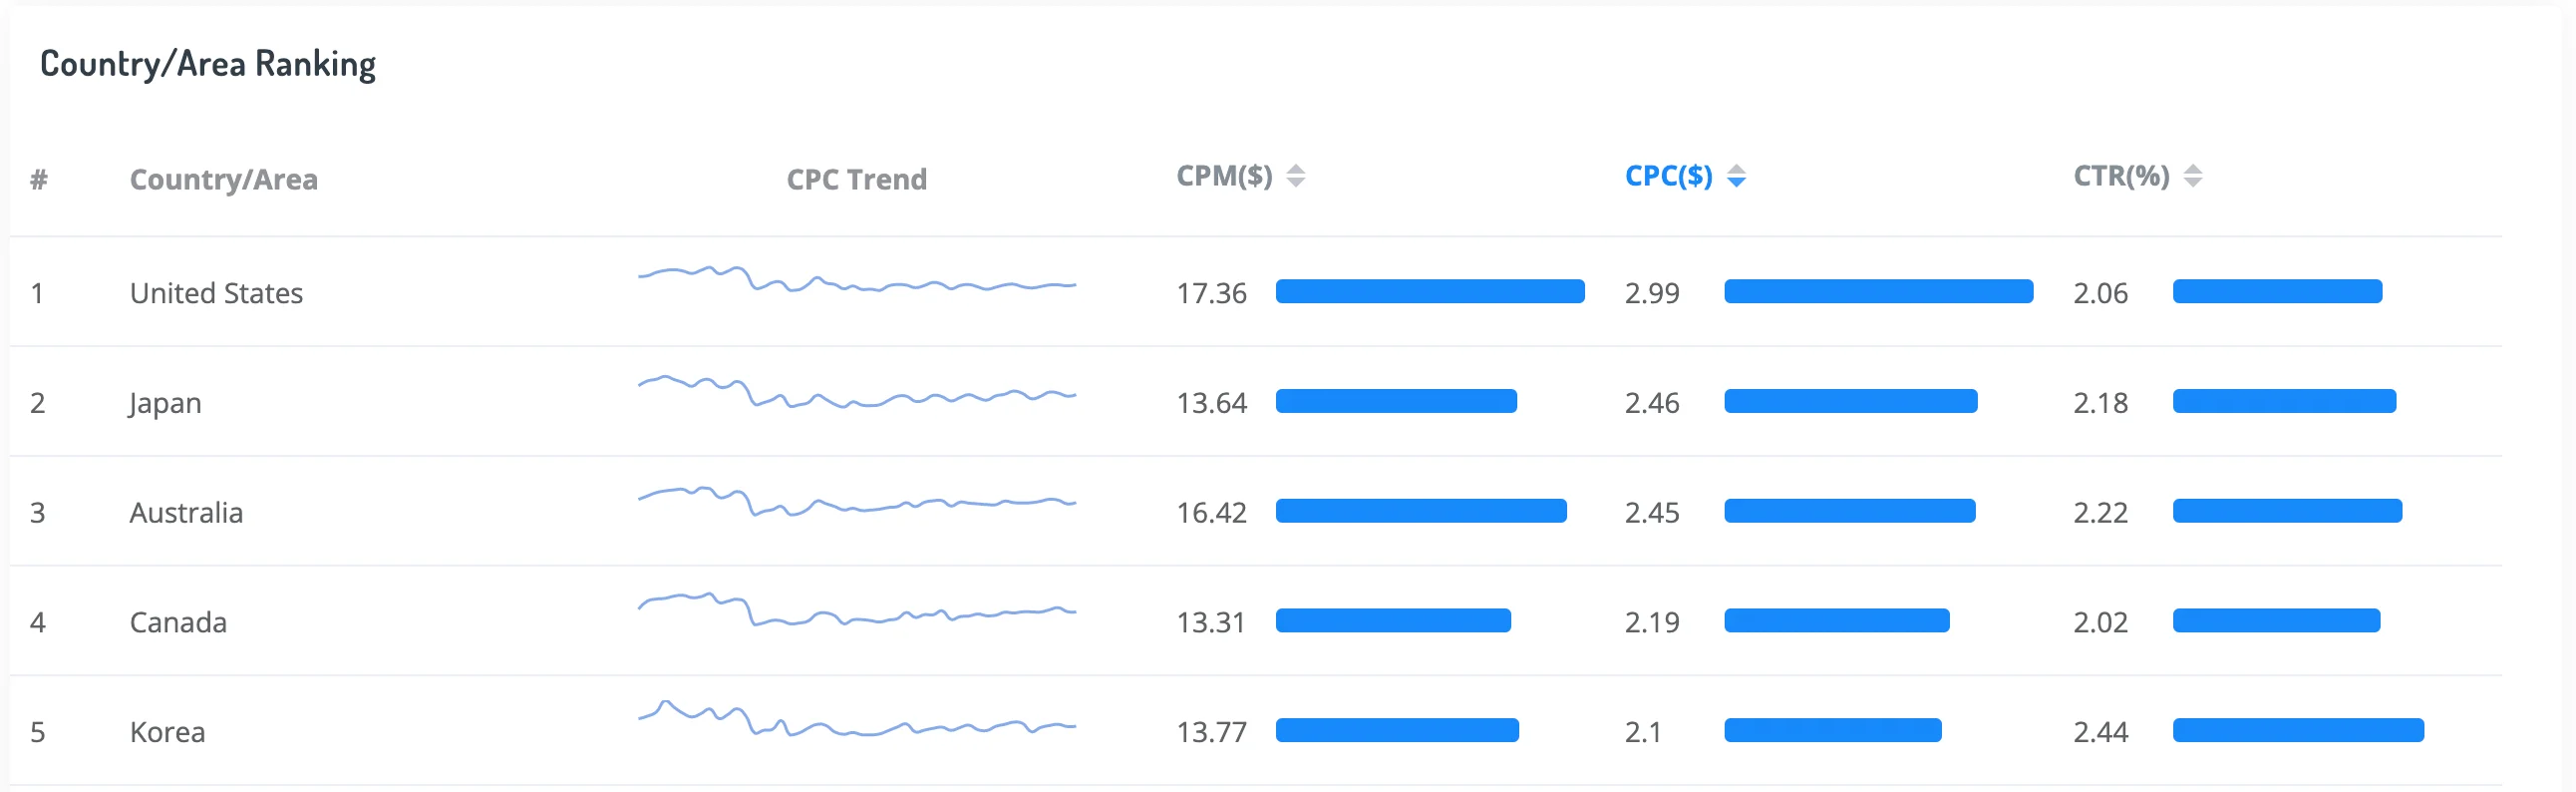
Top 5 Countries by CPC
The list of countries is slightly different in this case. Japan and Canada topped Germany and Singapore. The United States is still on top of the list.
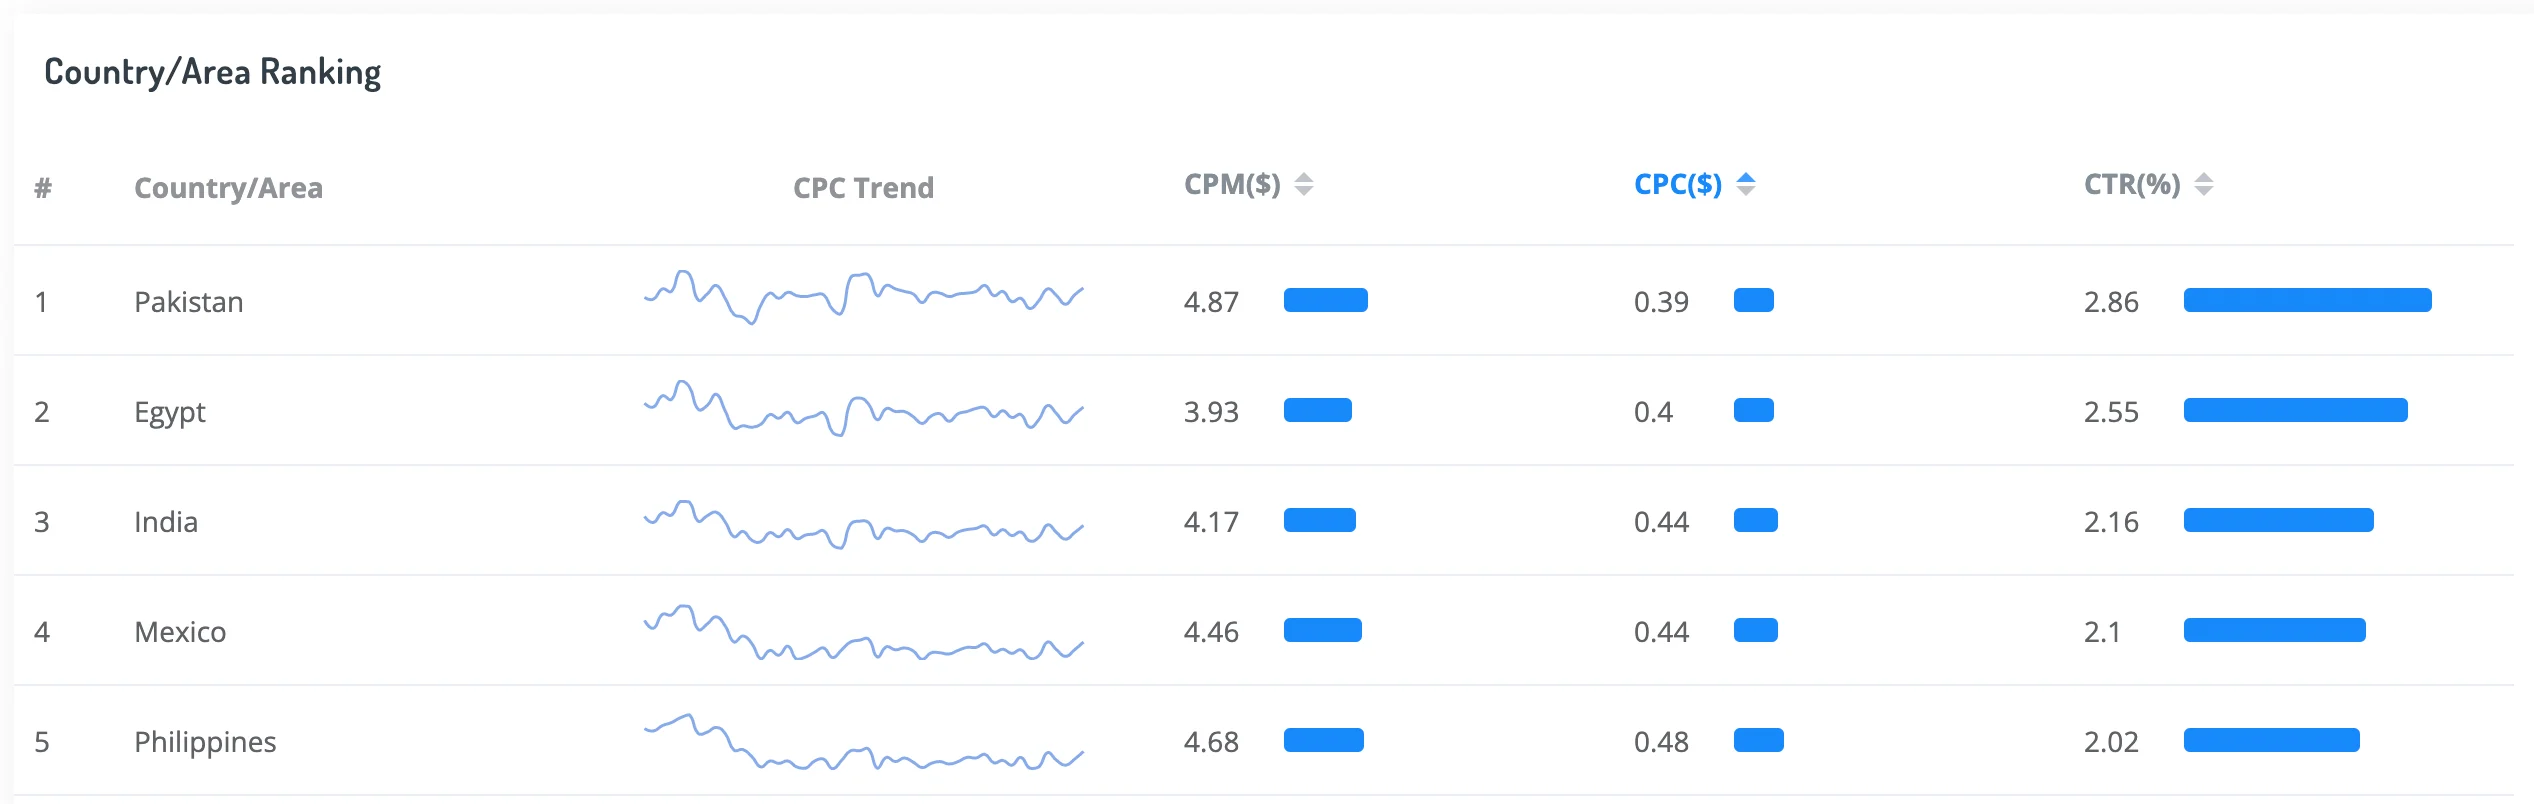
Pakistan tops the lowest CPC indicator list, followed by Egypt, India, Mexico, and the Philippines.
Top 5 Countries by CTR
What about the CTR in less developed countries? Singapore stands out in this list, with a high cost per view and cost per click, and a high CTR.
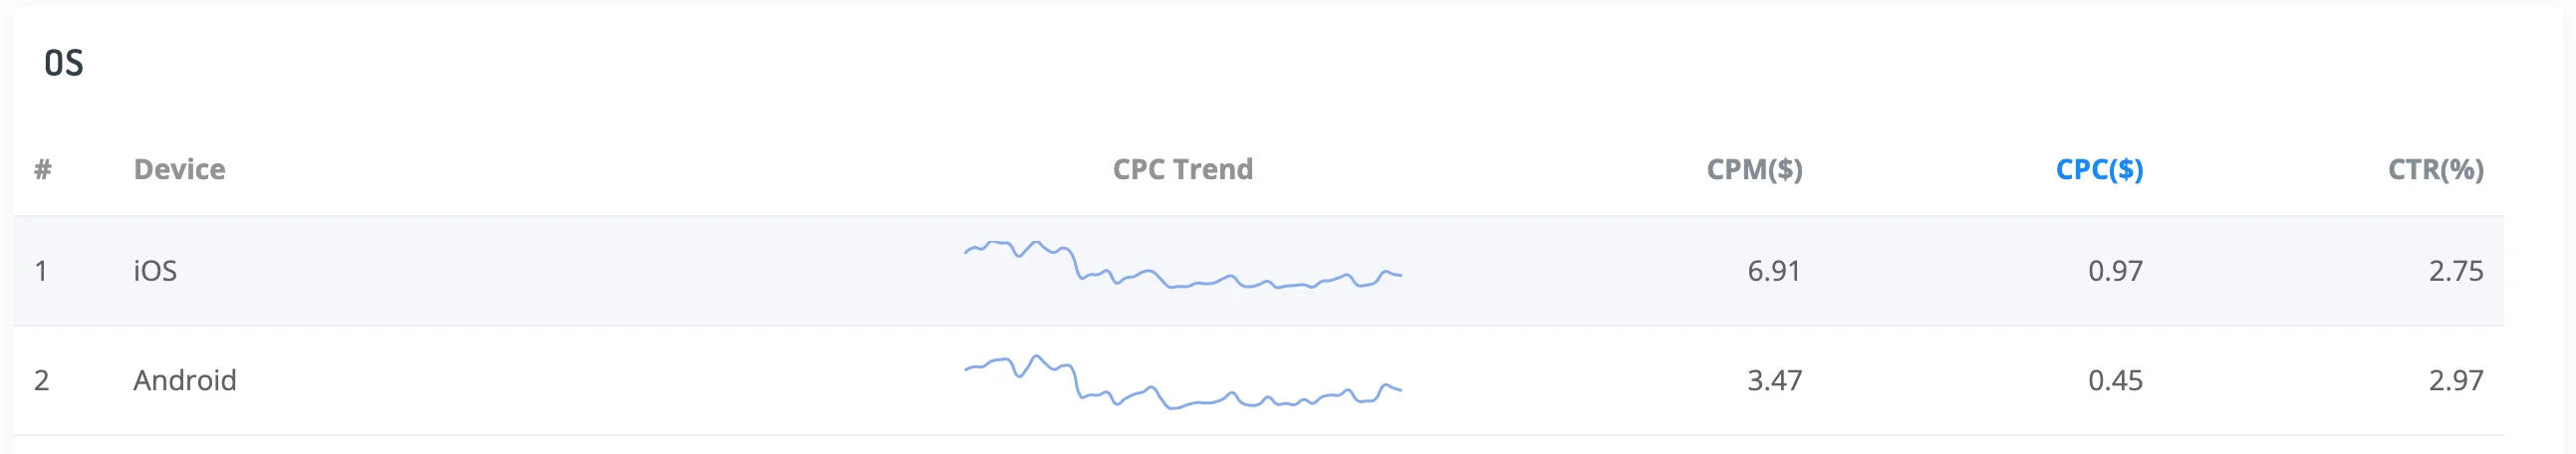
Cost of Advertising on Various Mobile Platforms
No surprises here: CPM and CPC are two times higher for iOS with almost the same CTR.
Q4 2021 Facebook Ads Statistics
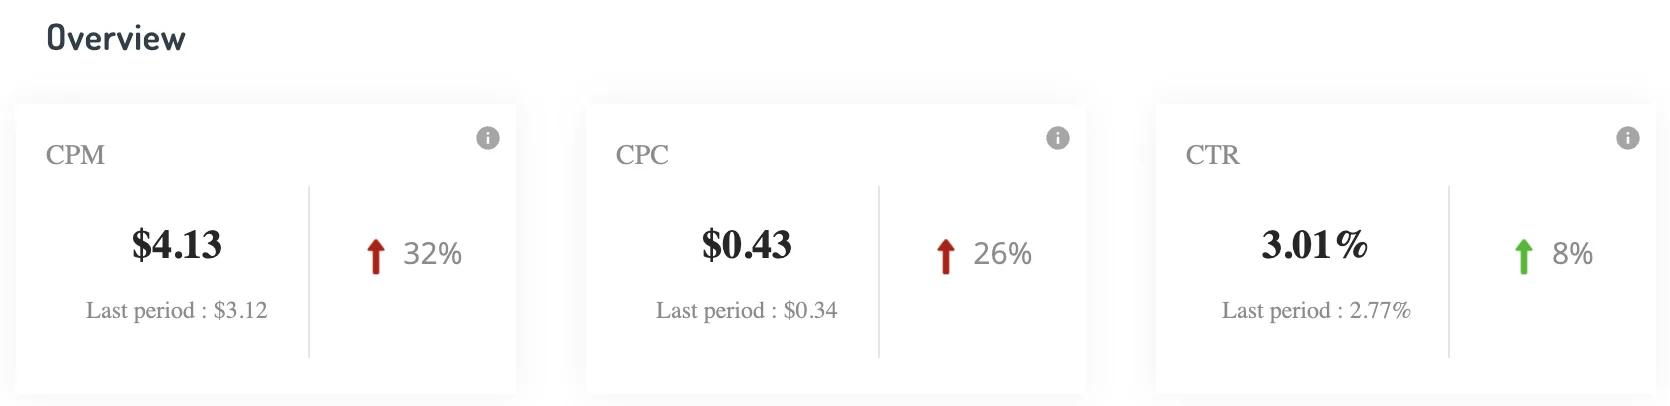
Q4 2021 CPM, CPC, and CTR Indicators
If we consider the statistics for the incomplete fourth quarter of 2021, we’ll see a steady growth among all indicators.
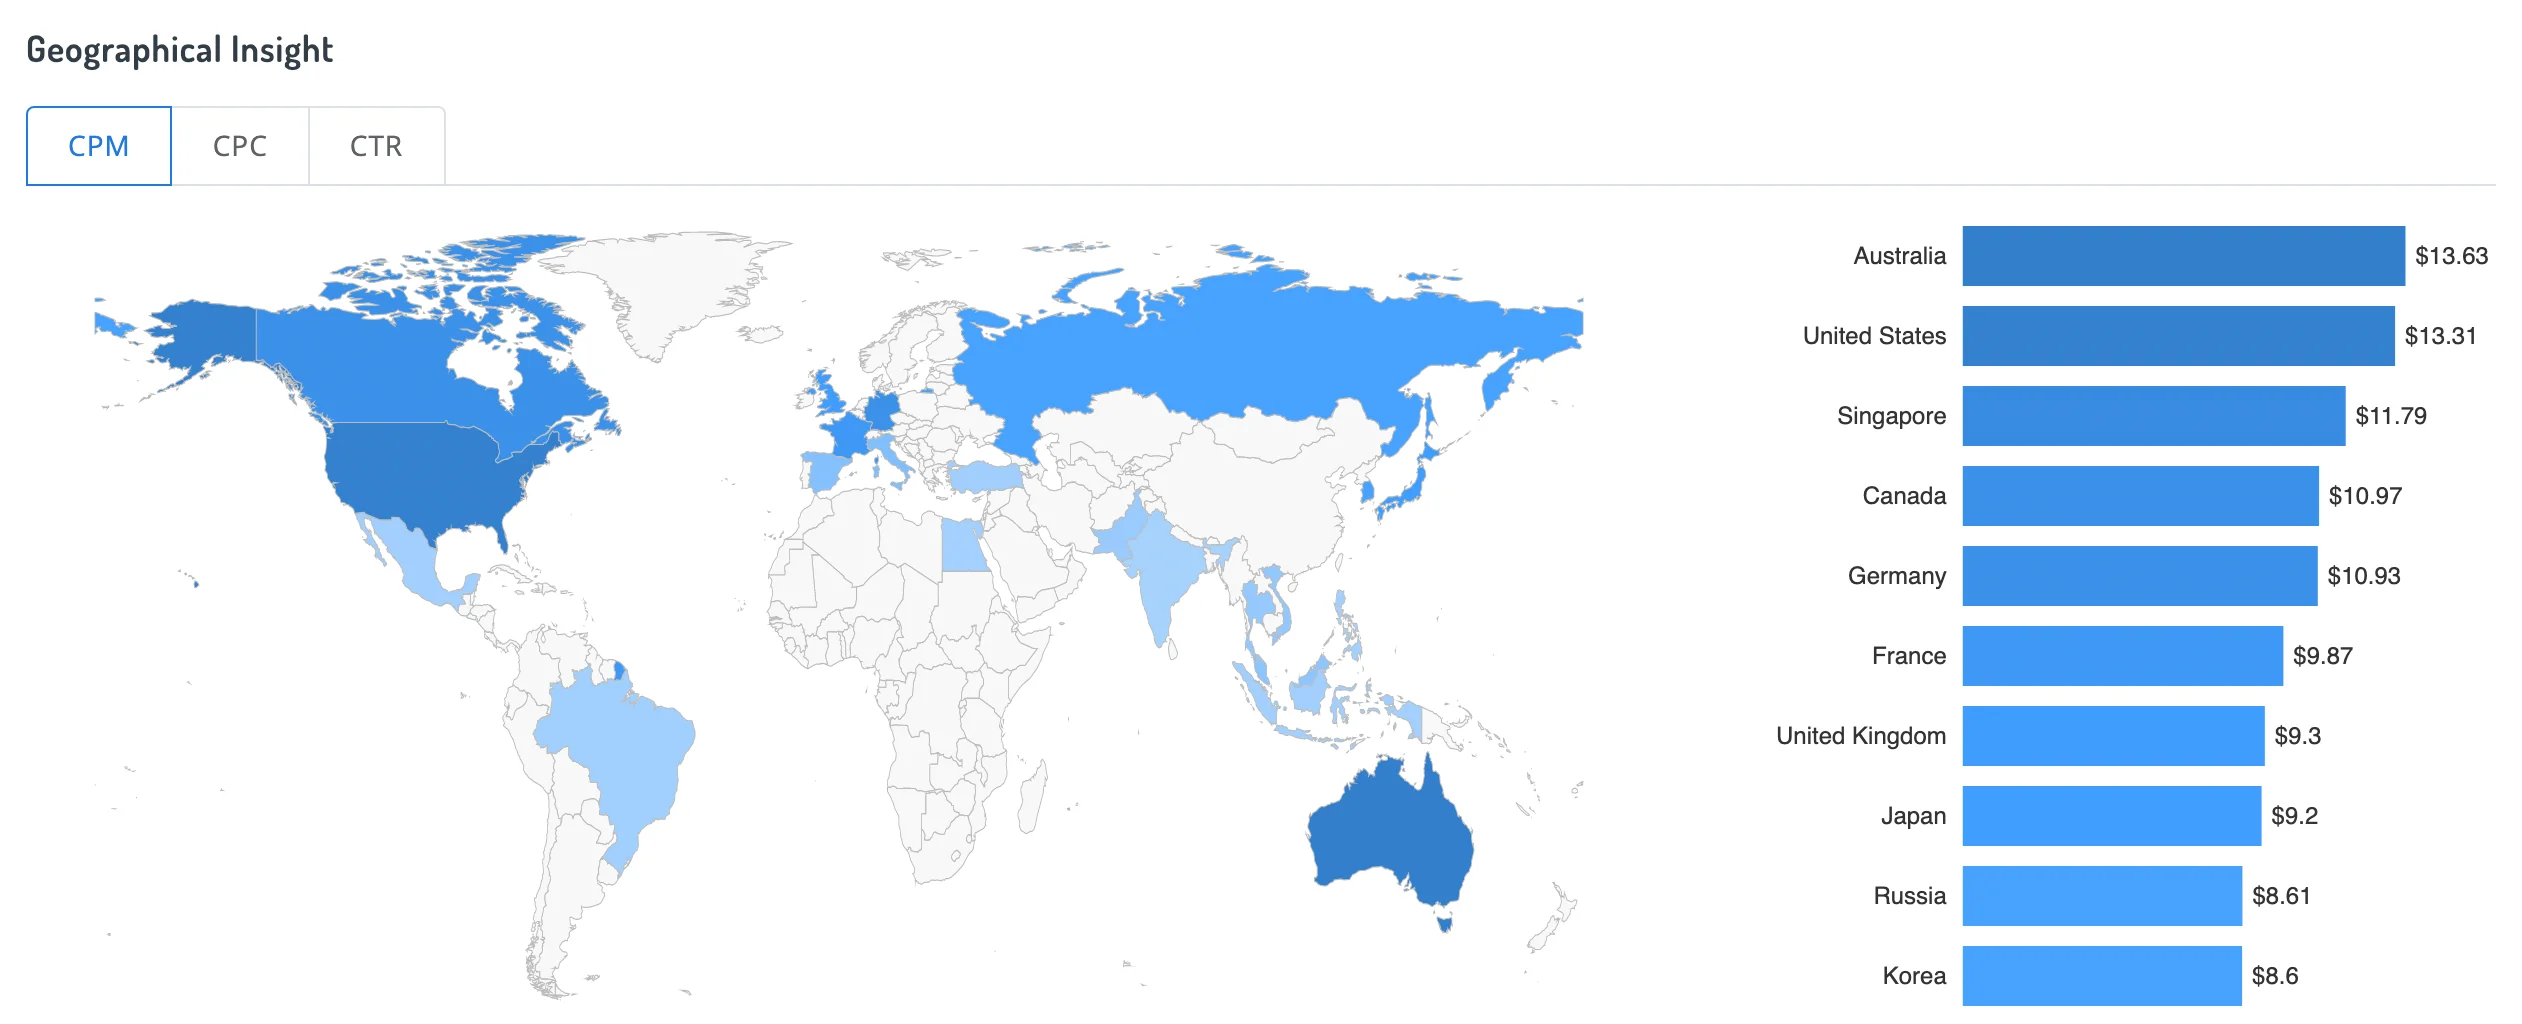
CPM by Country
Australia is a cost per 1,000 impressions leader with a CPM of $13.63.
Russia entered the top 10, ranking ninth with a CPM of $8.61.
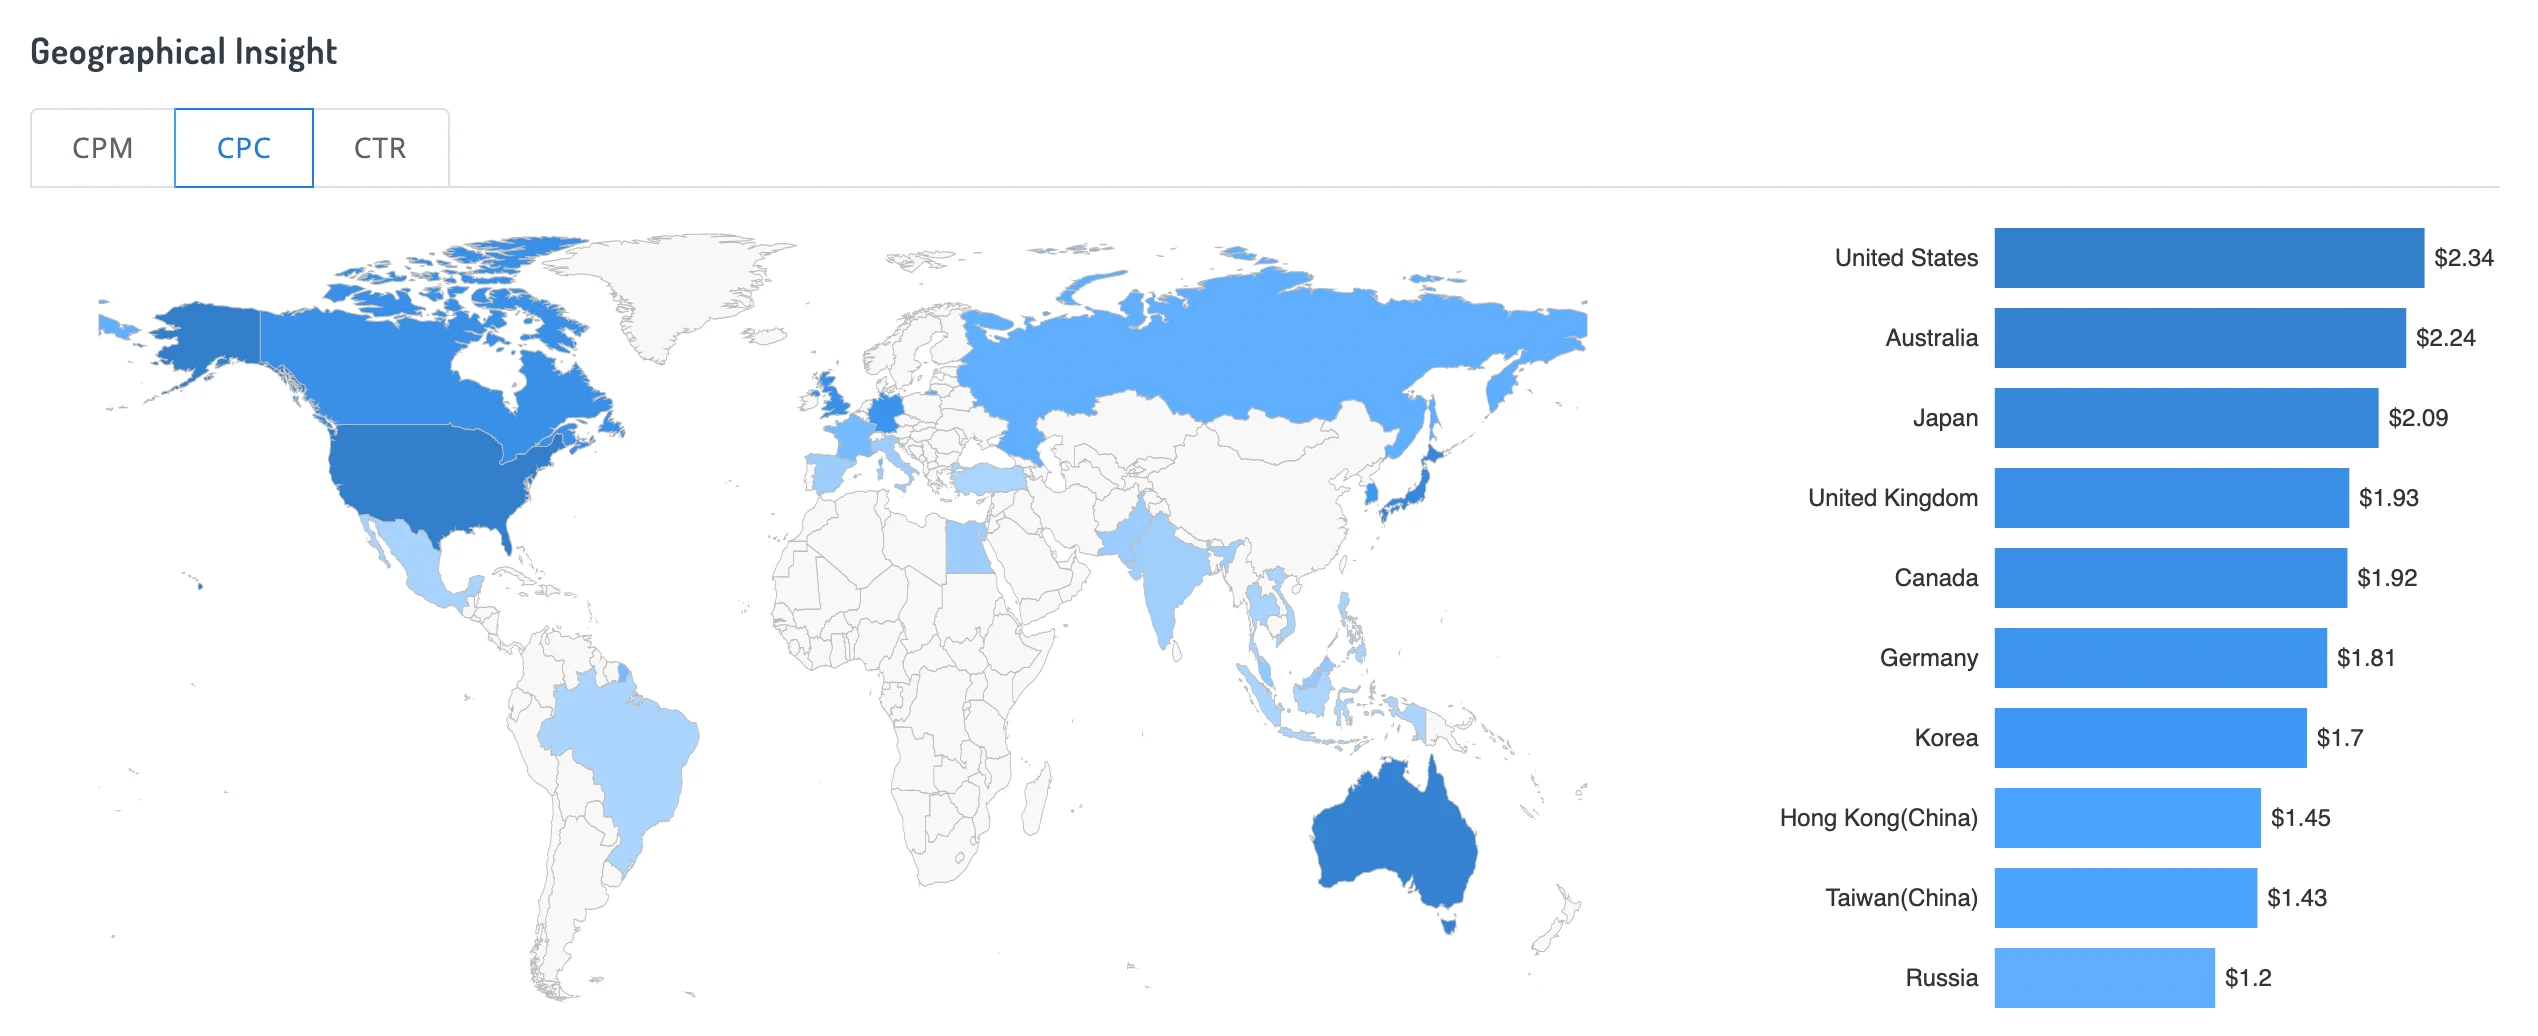
CPC by Country
The U.S. keeps the leading position with an average cost per click of $2.34.
Russia occupies the tenth rating position with a CPC of $1.2.
CTR by Country
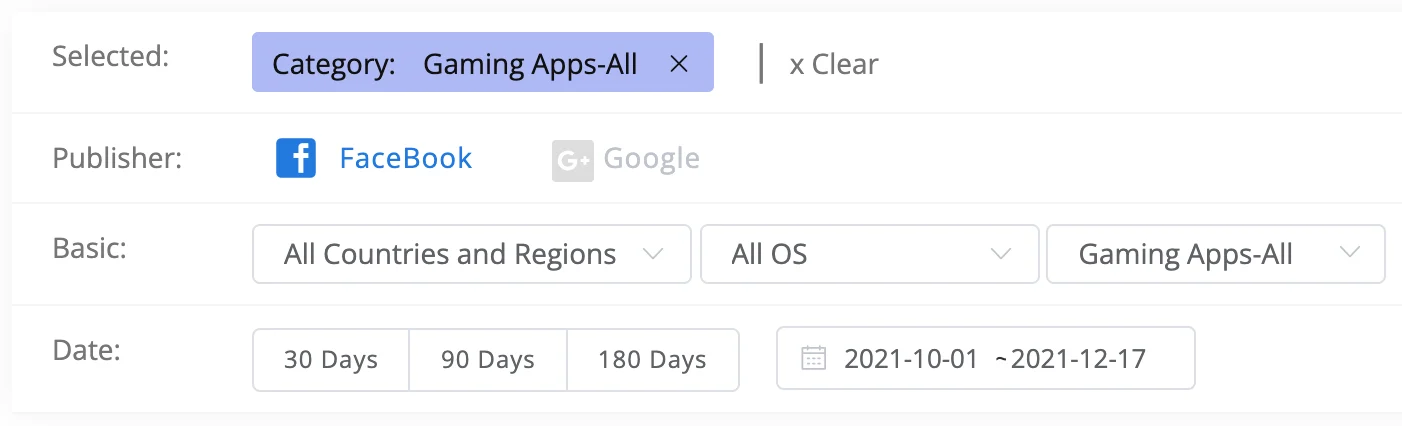
The Cost of Facebook Ads in the Gaming Apps Category
ADCostly allows selecting ad categories to view. Let’s consider the statistics of a popular Gaming Apps category which includes gambling apps as well.
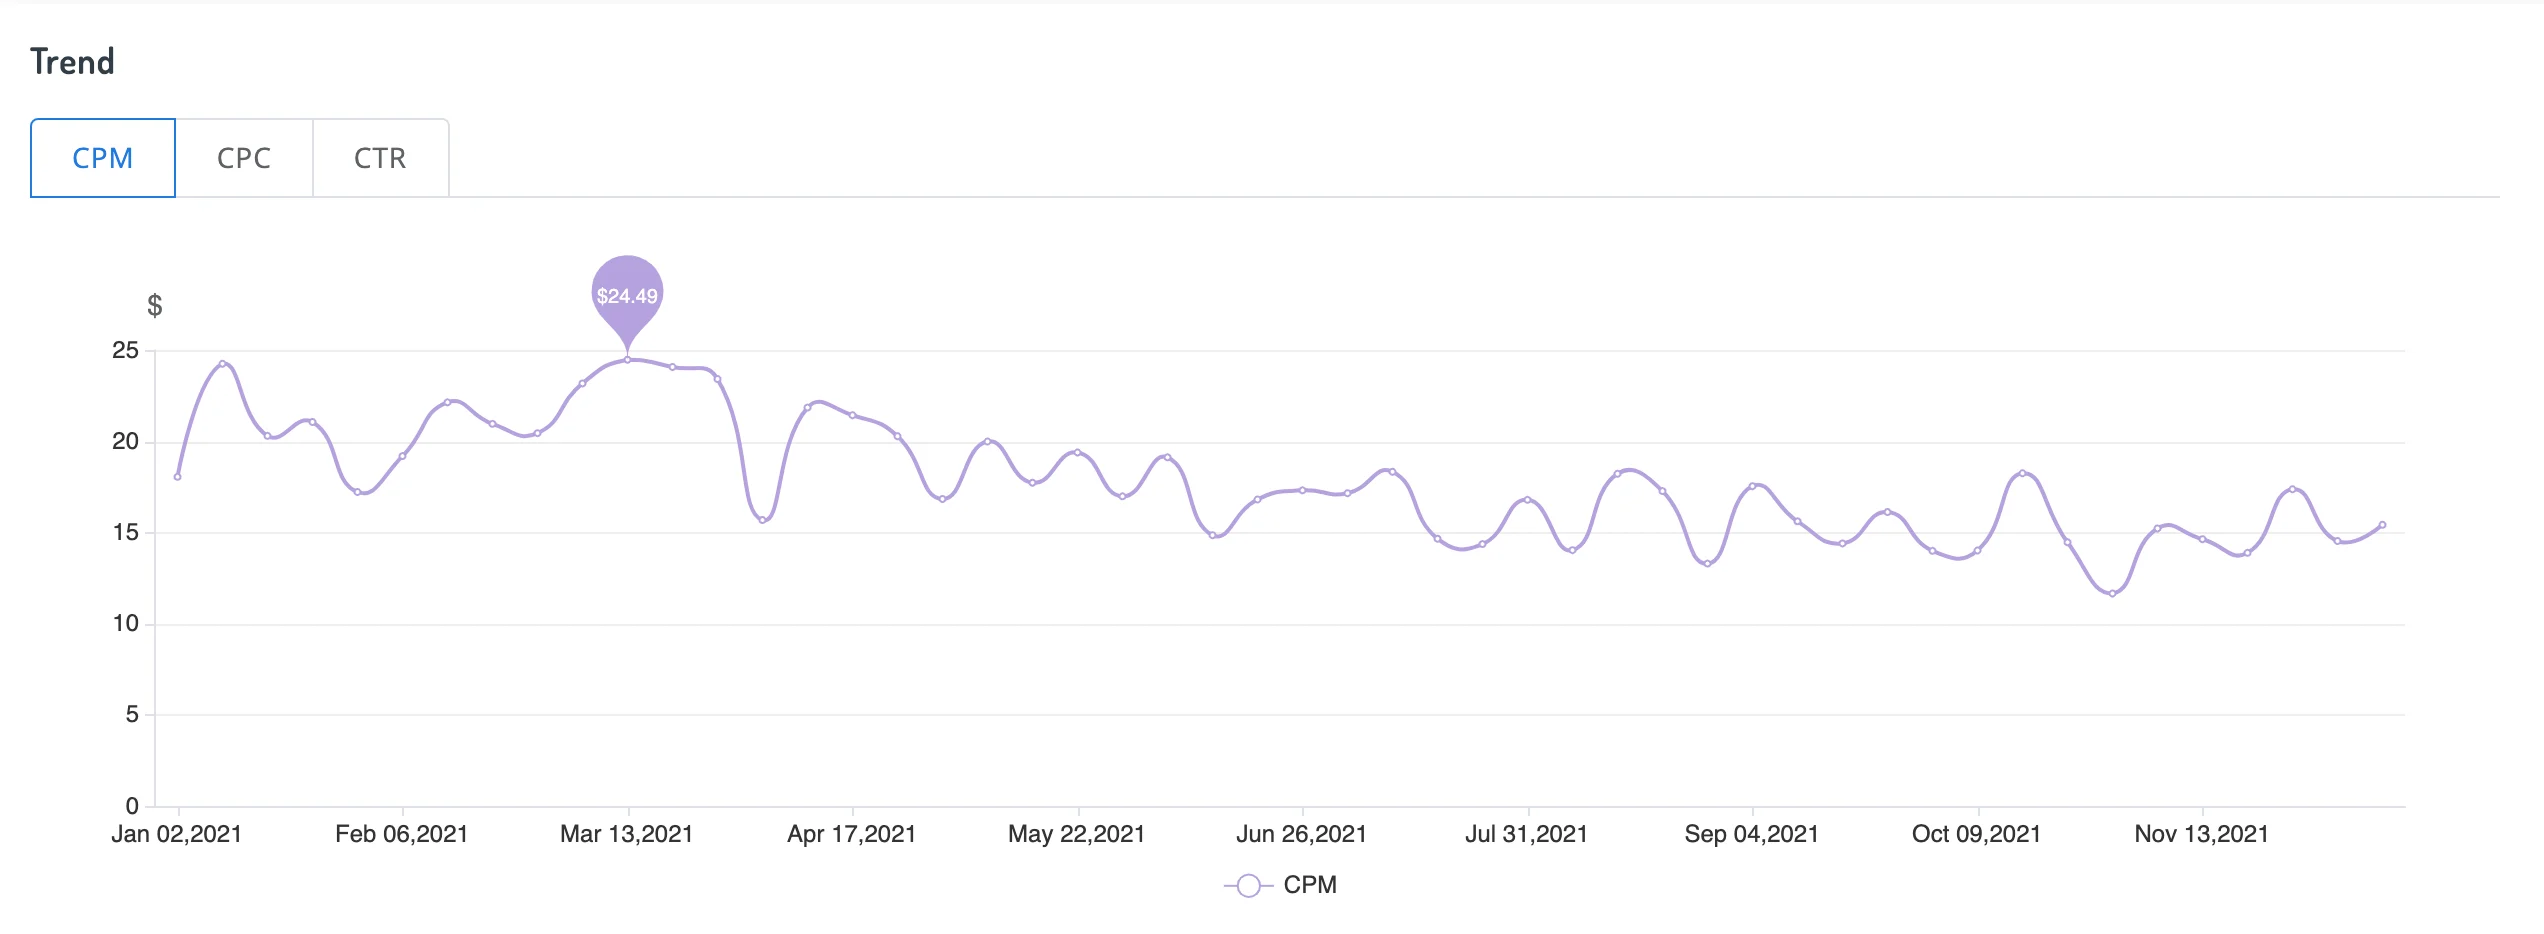
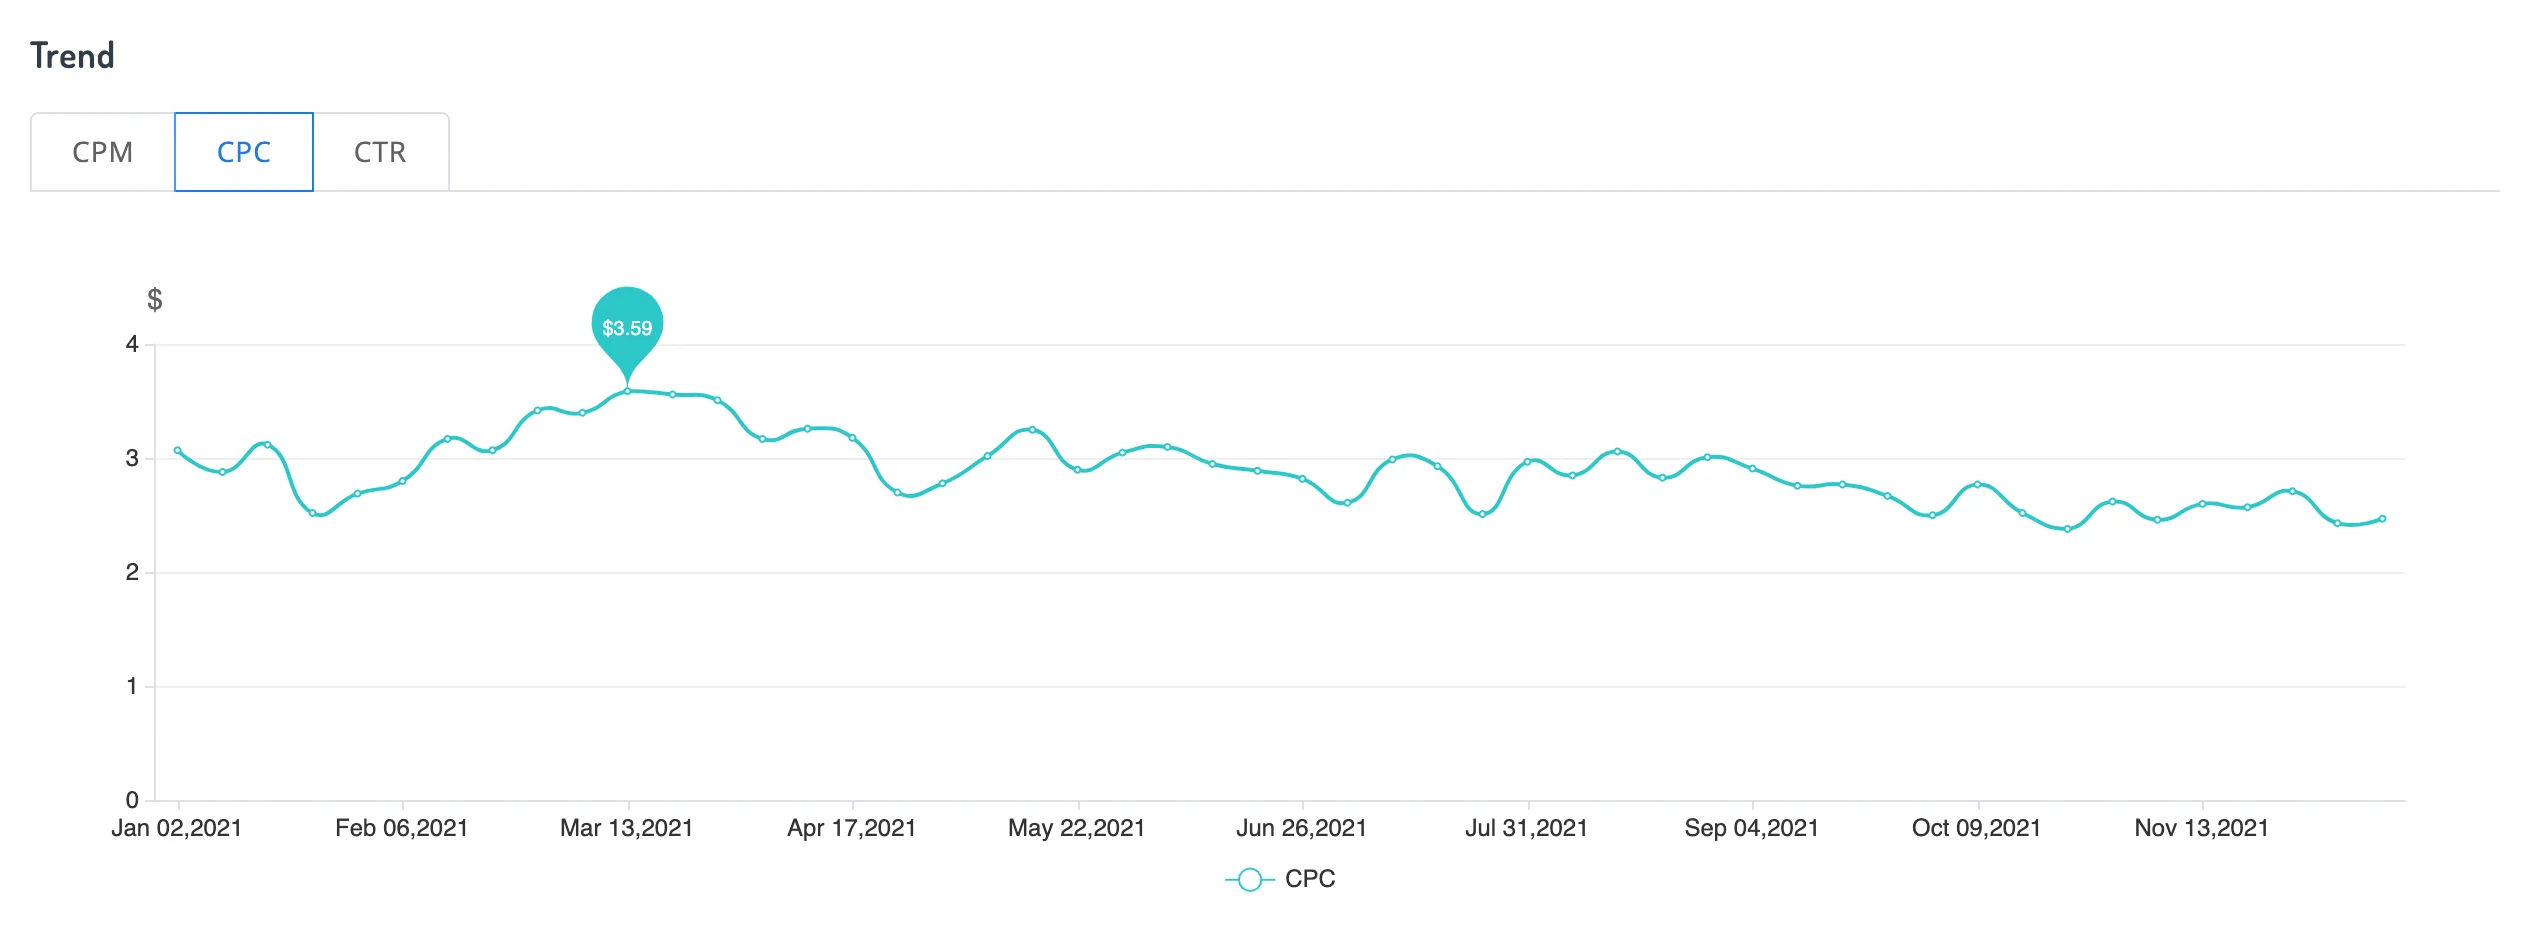
2021 Dynamics
The graphs illustrate that CPM and CPC decreased from 1.5 to 2 times over the year 2021.
In-depth Q4 2021 Cost Indicators Analysis
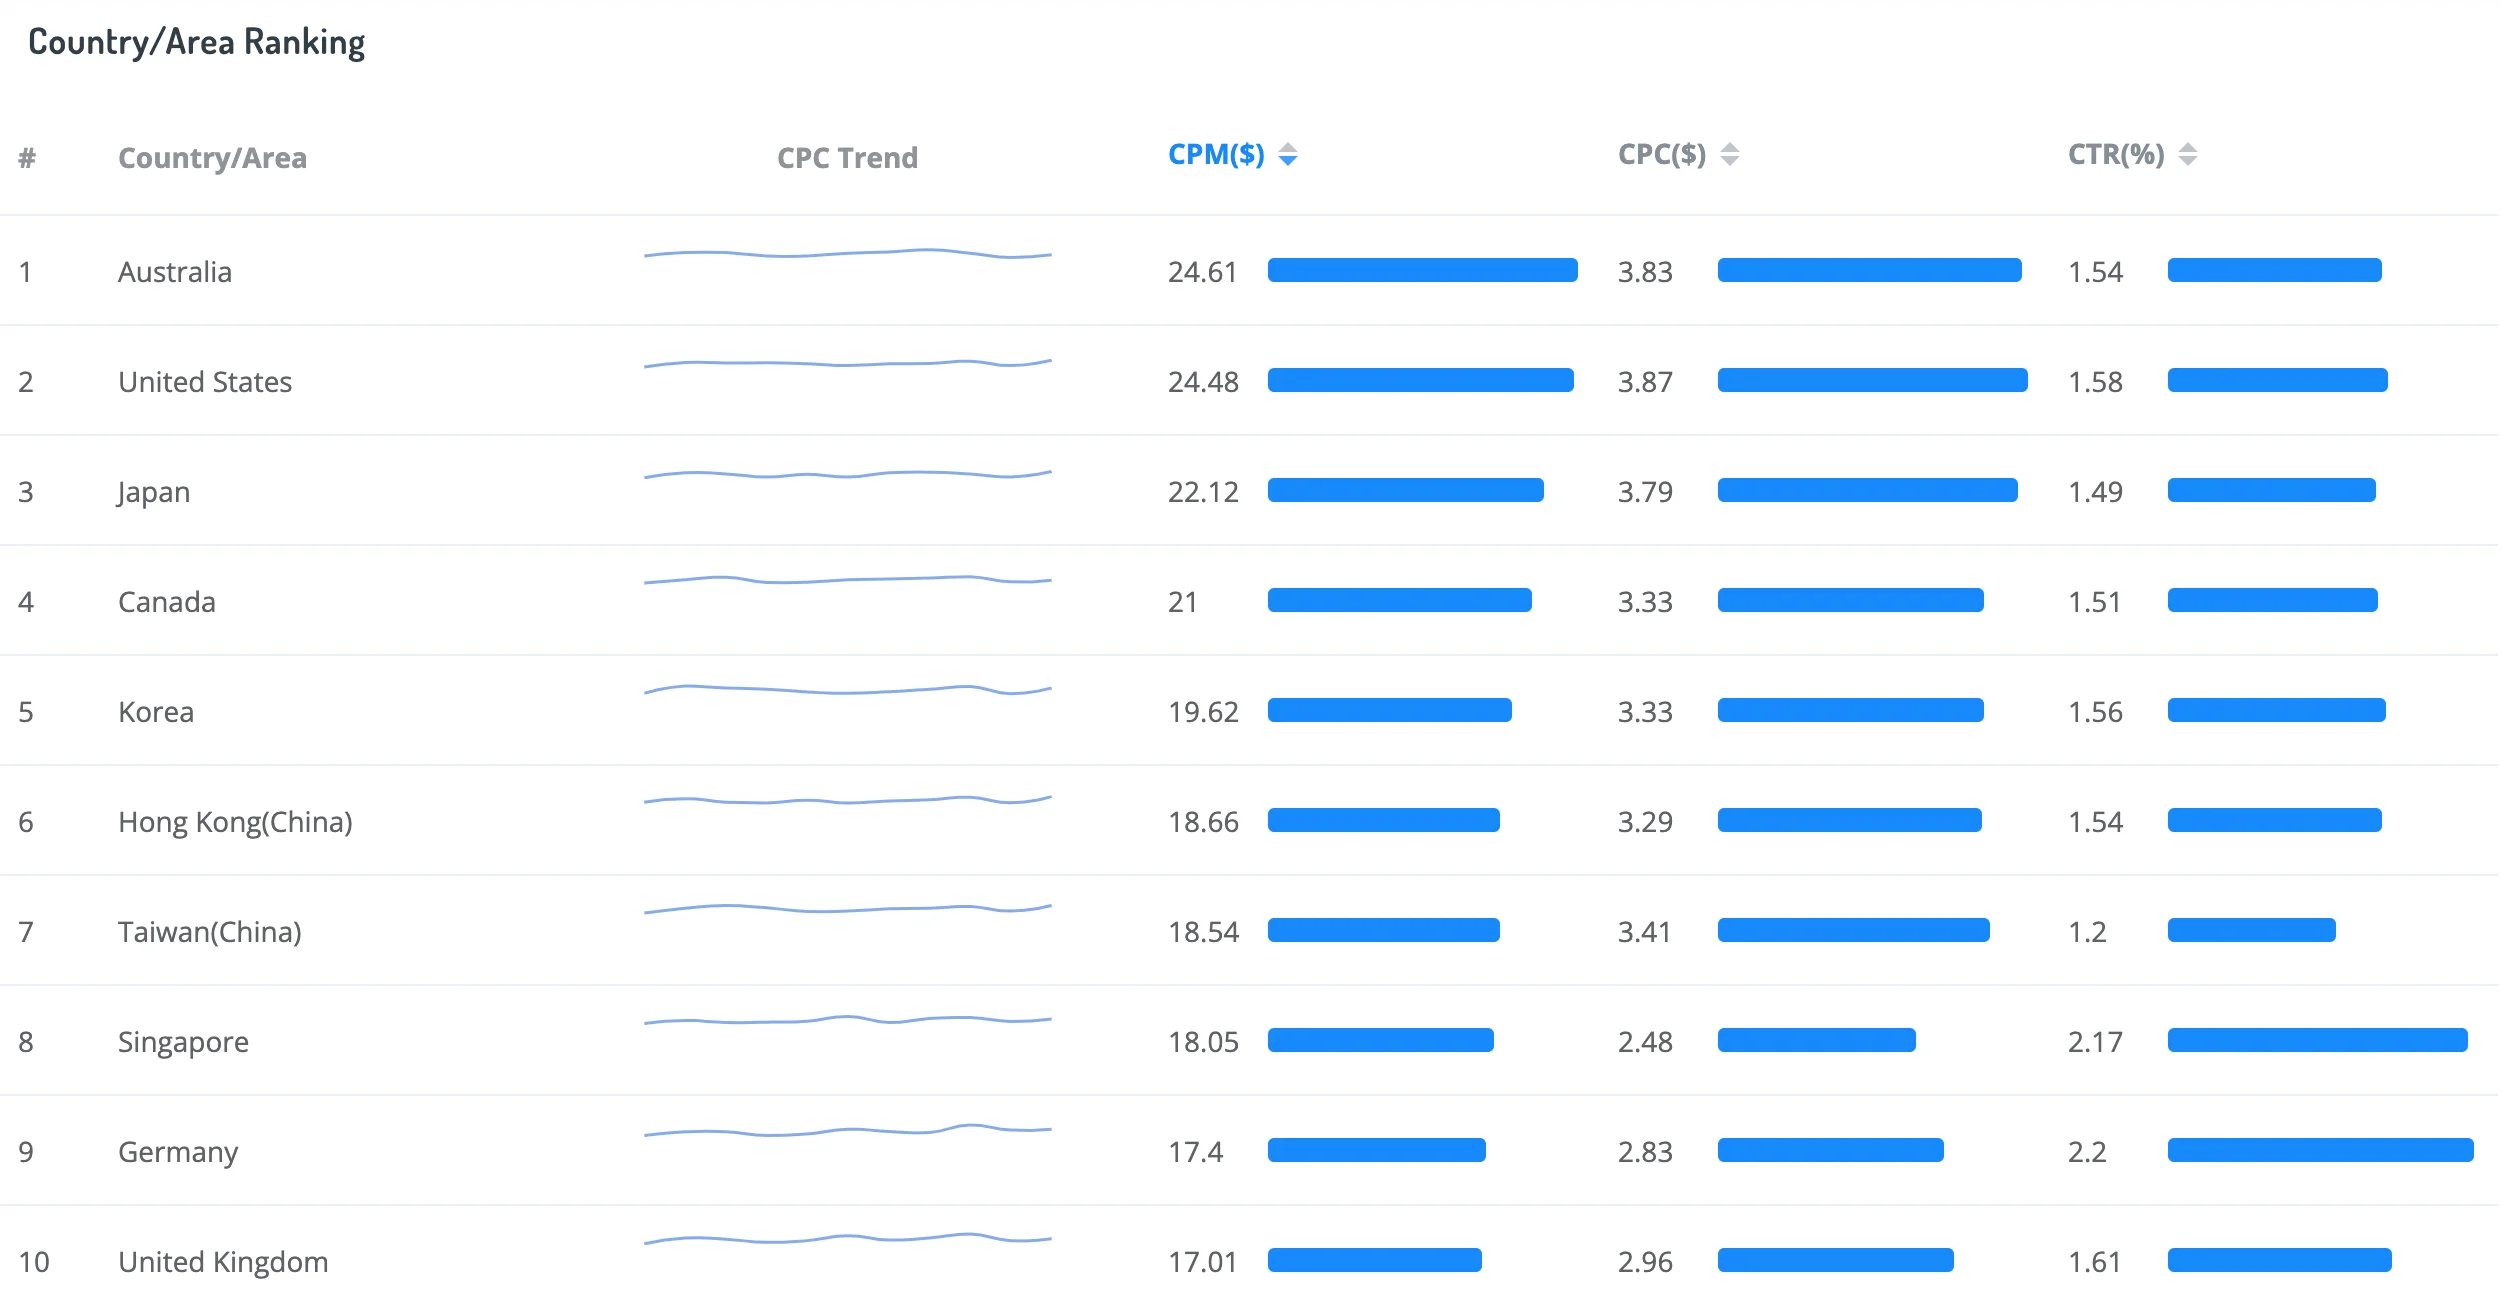
Cost of advertising for the last quarter of 2021 in the Gaming Apps category:
Australia again has the highest CPM of $24.6.
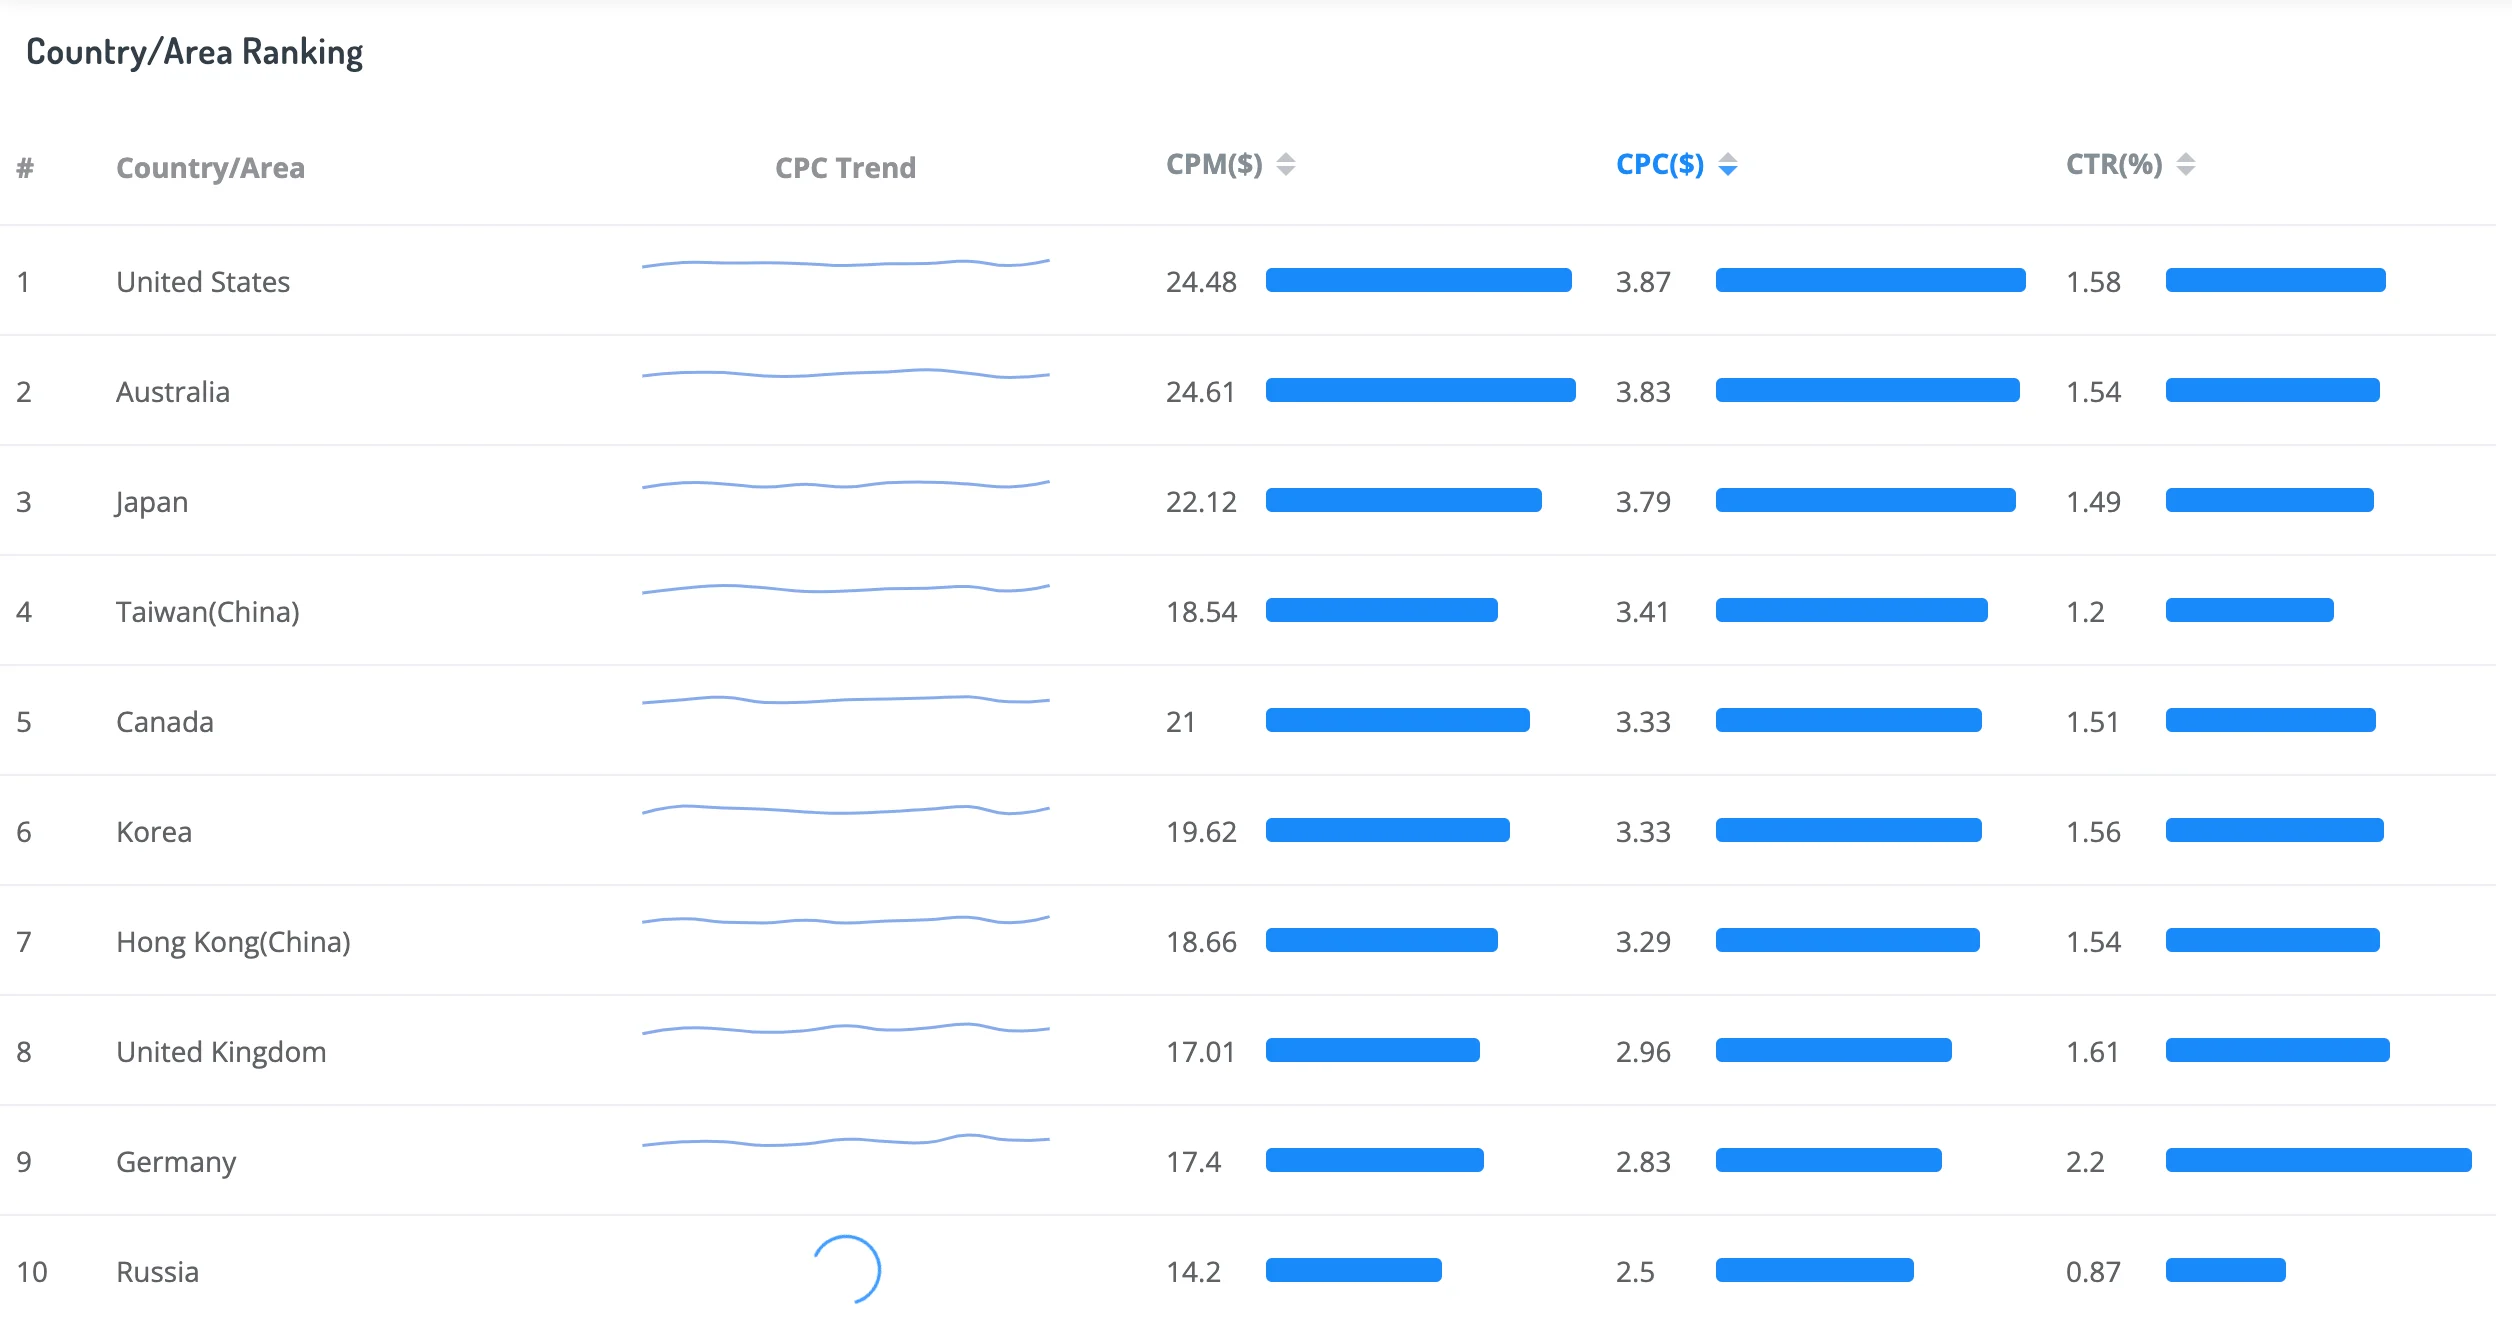
As to CPC, the U.S. is slightly ahead of Australia with an indicator of $3.87.
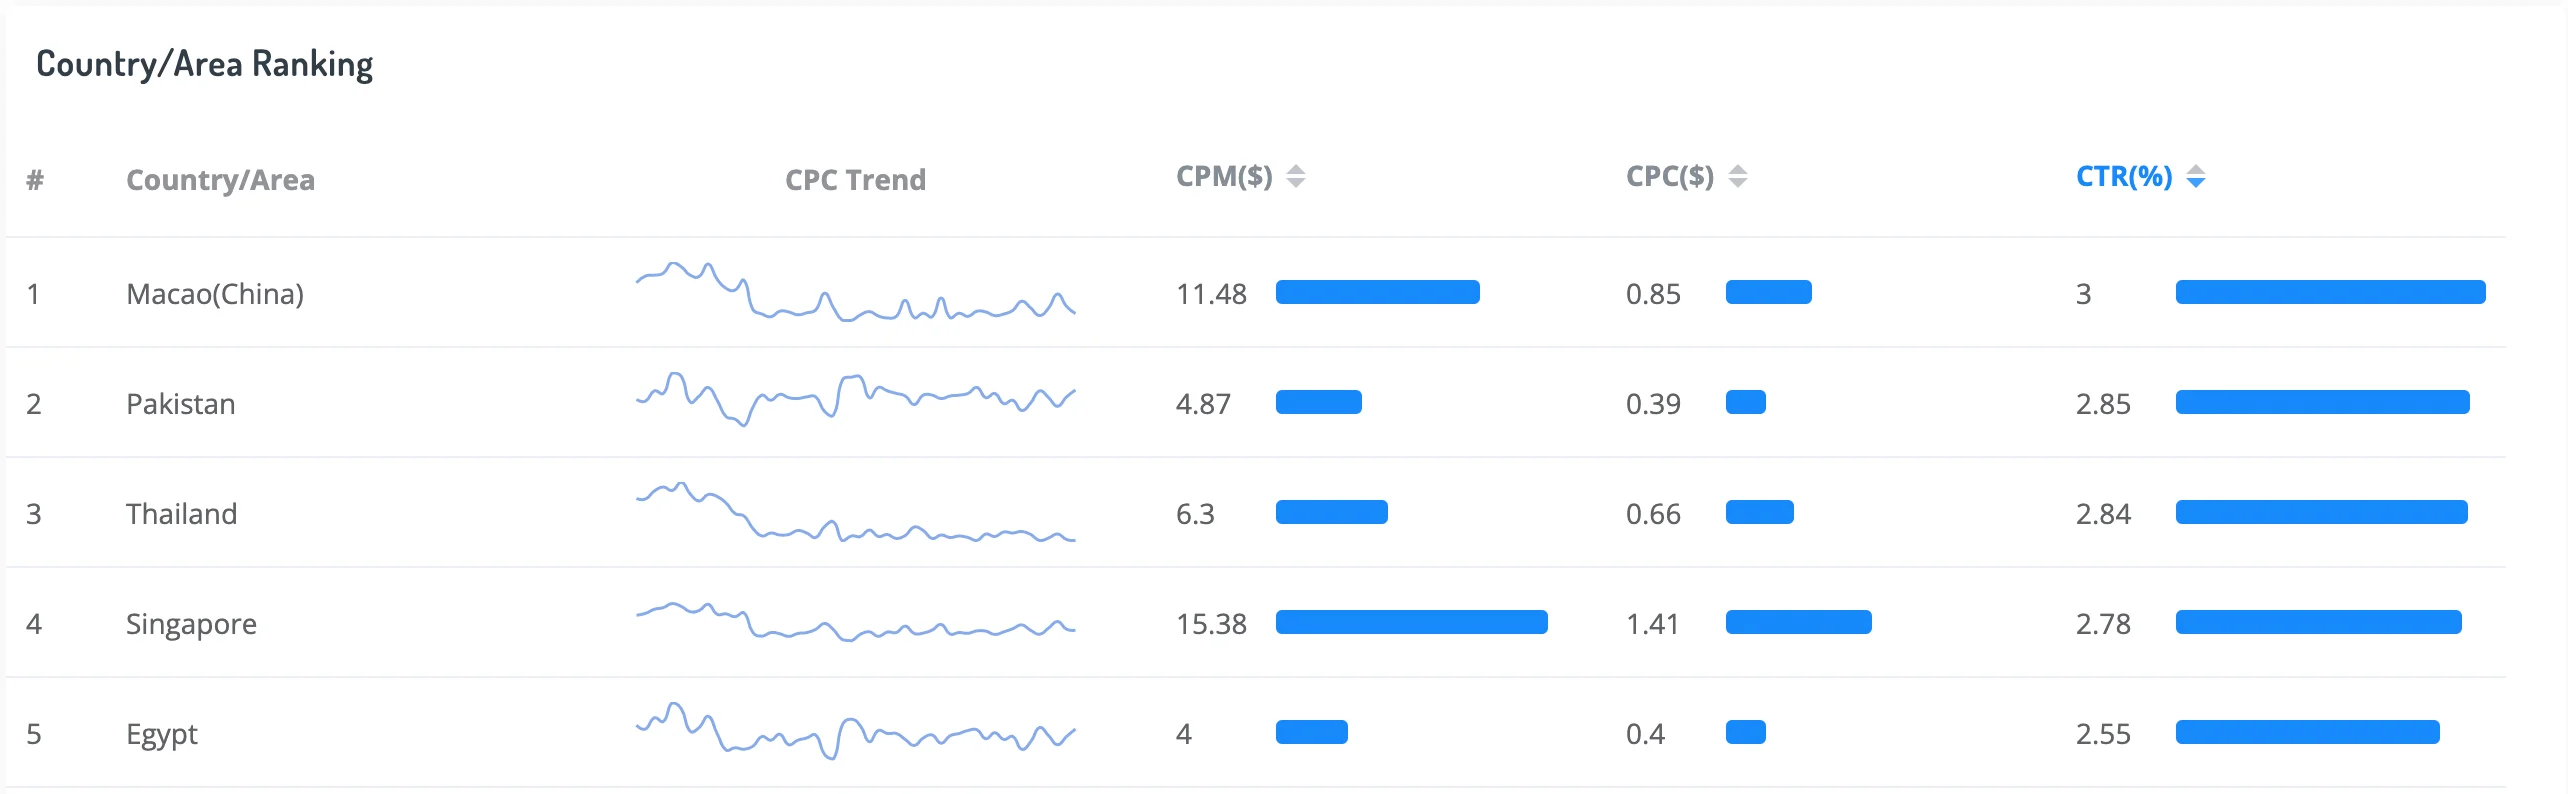
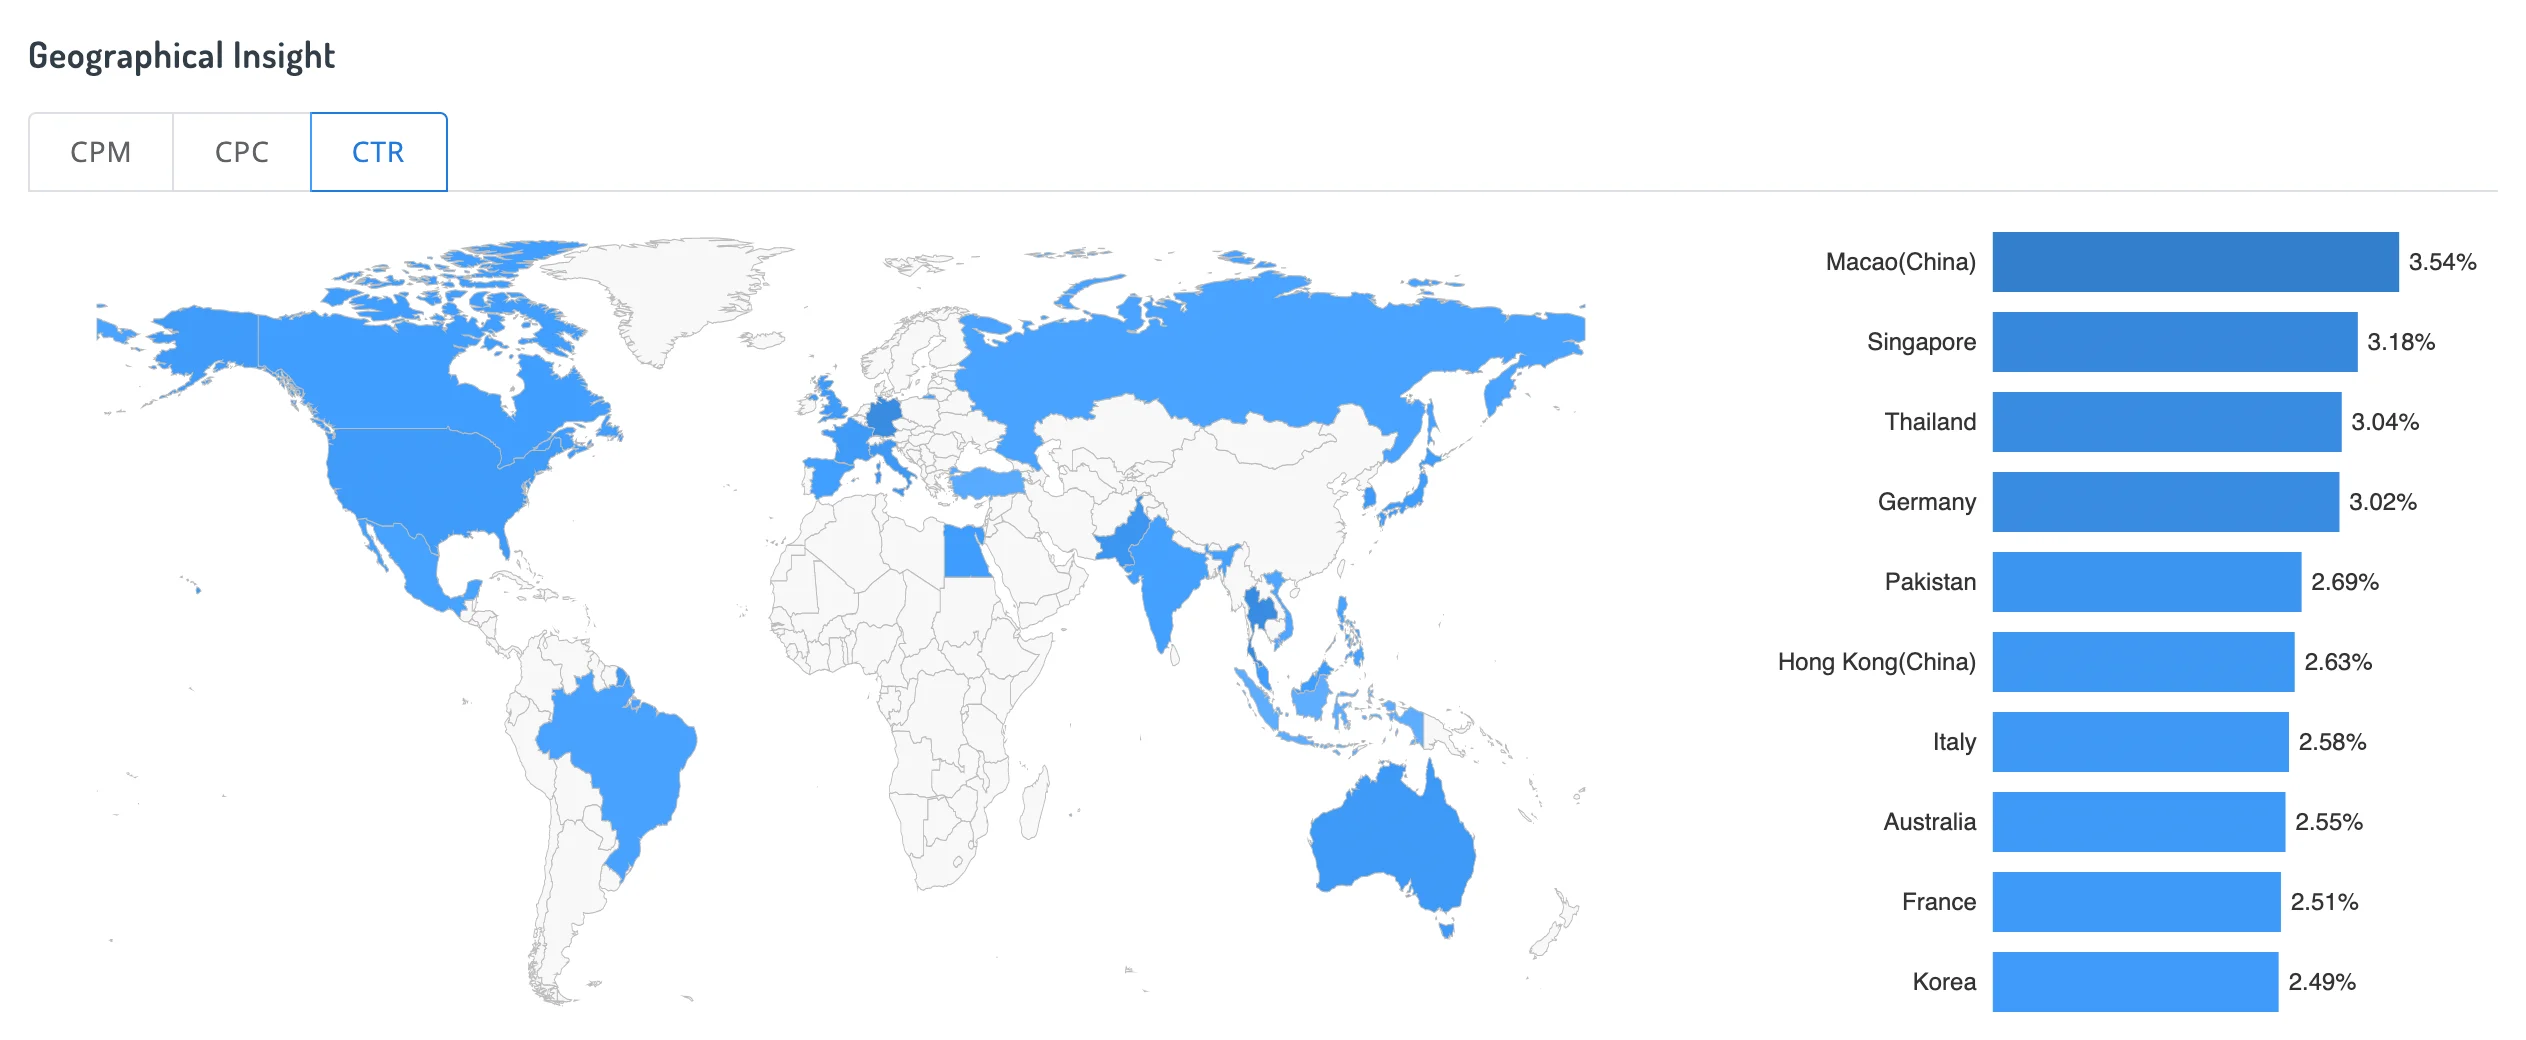
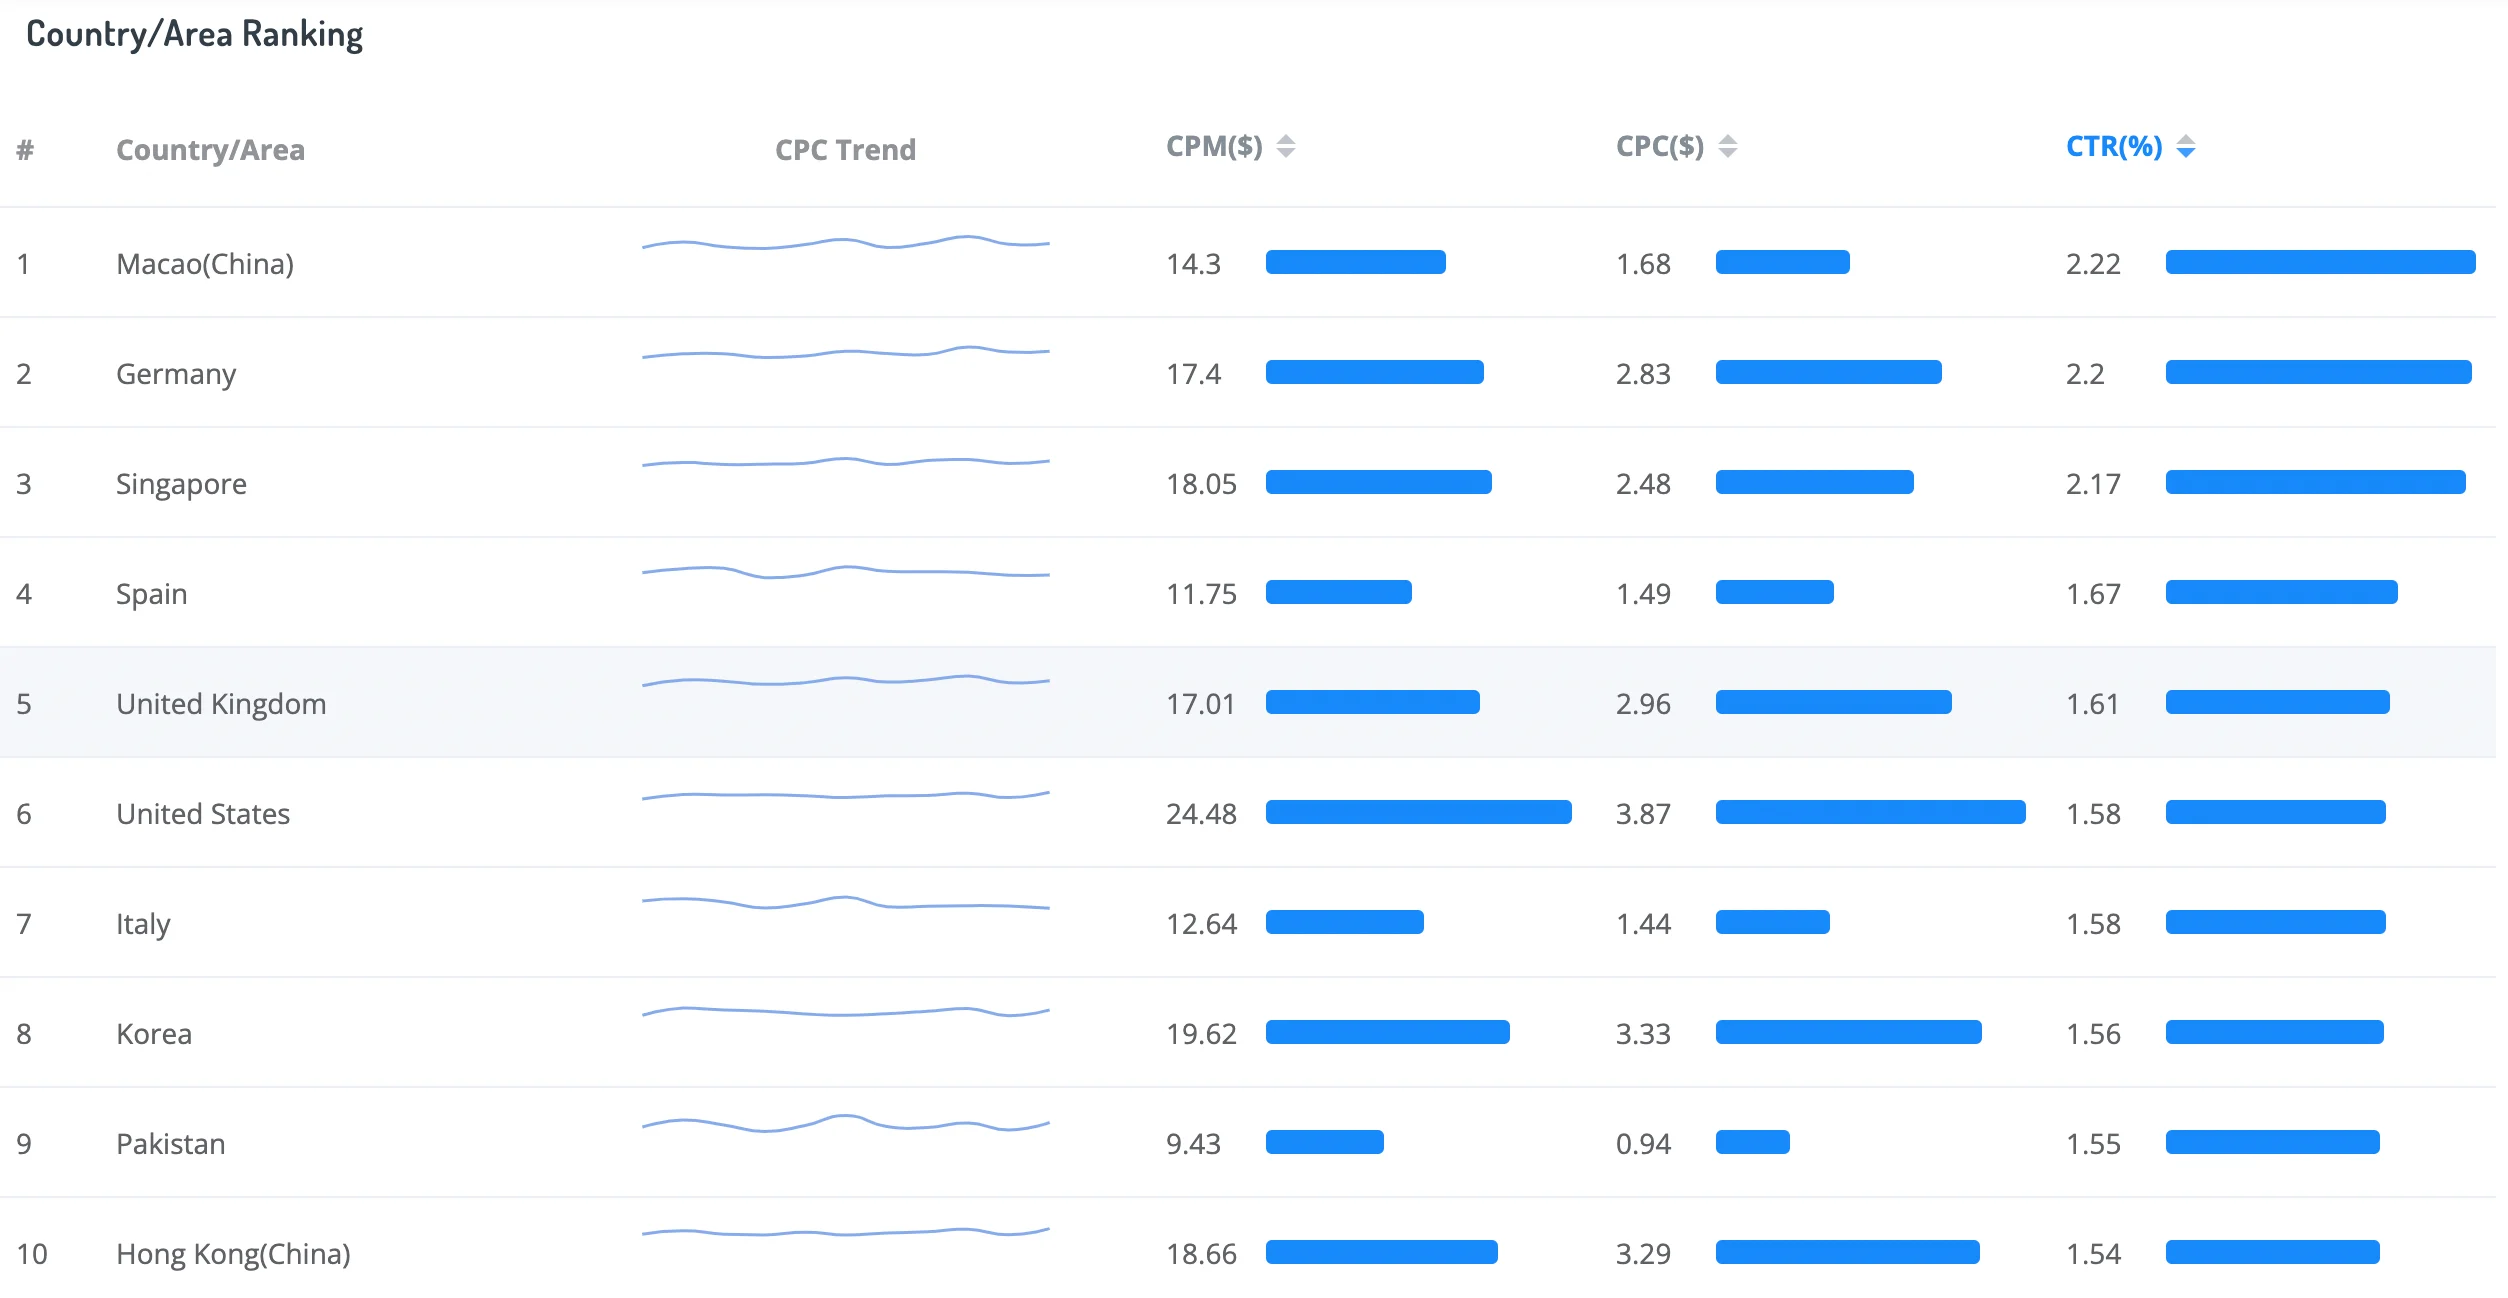
Macau, Germany, and Singapore have a leading CTR rating.
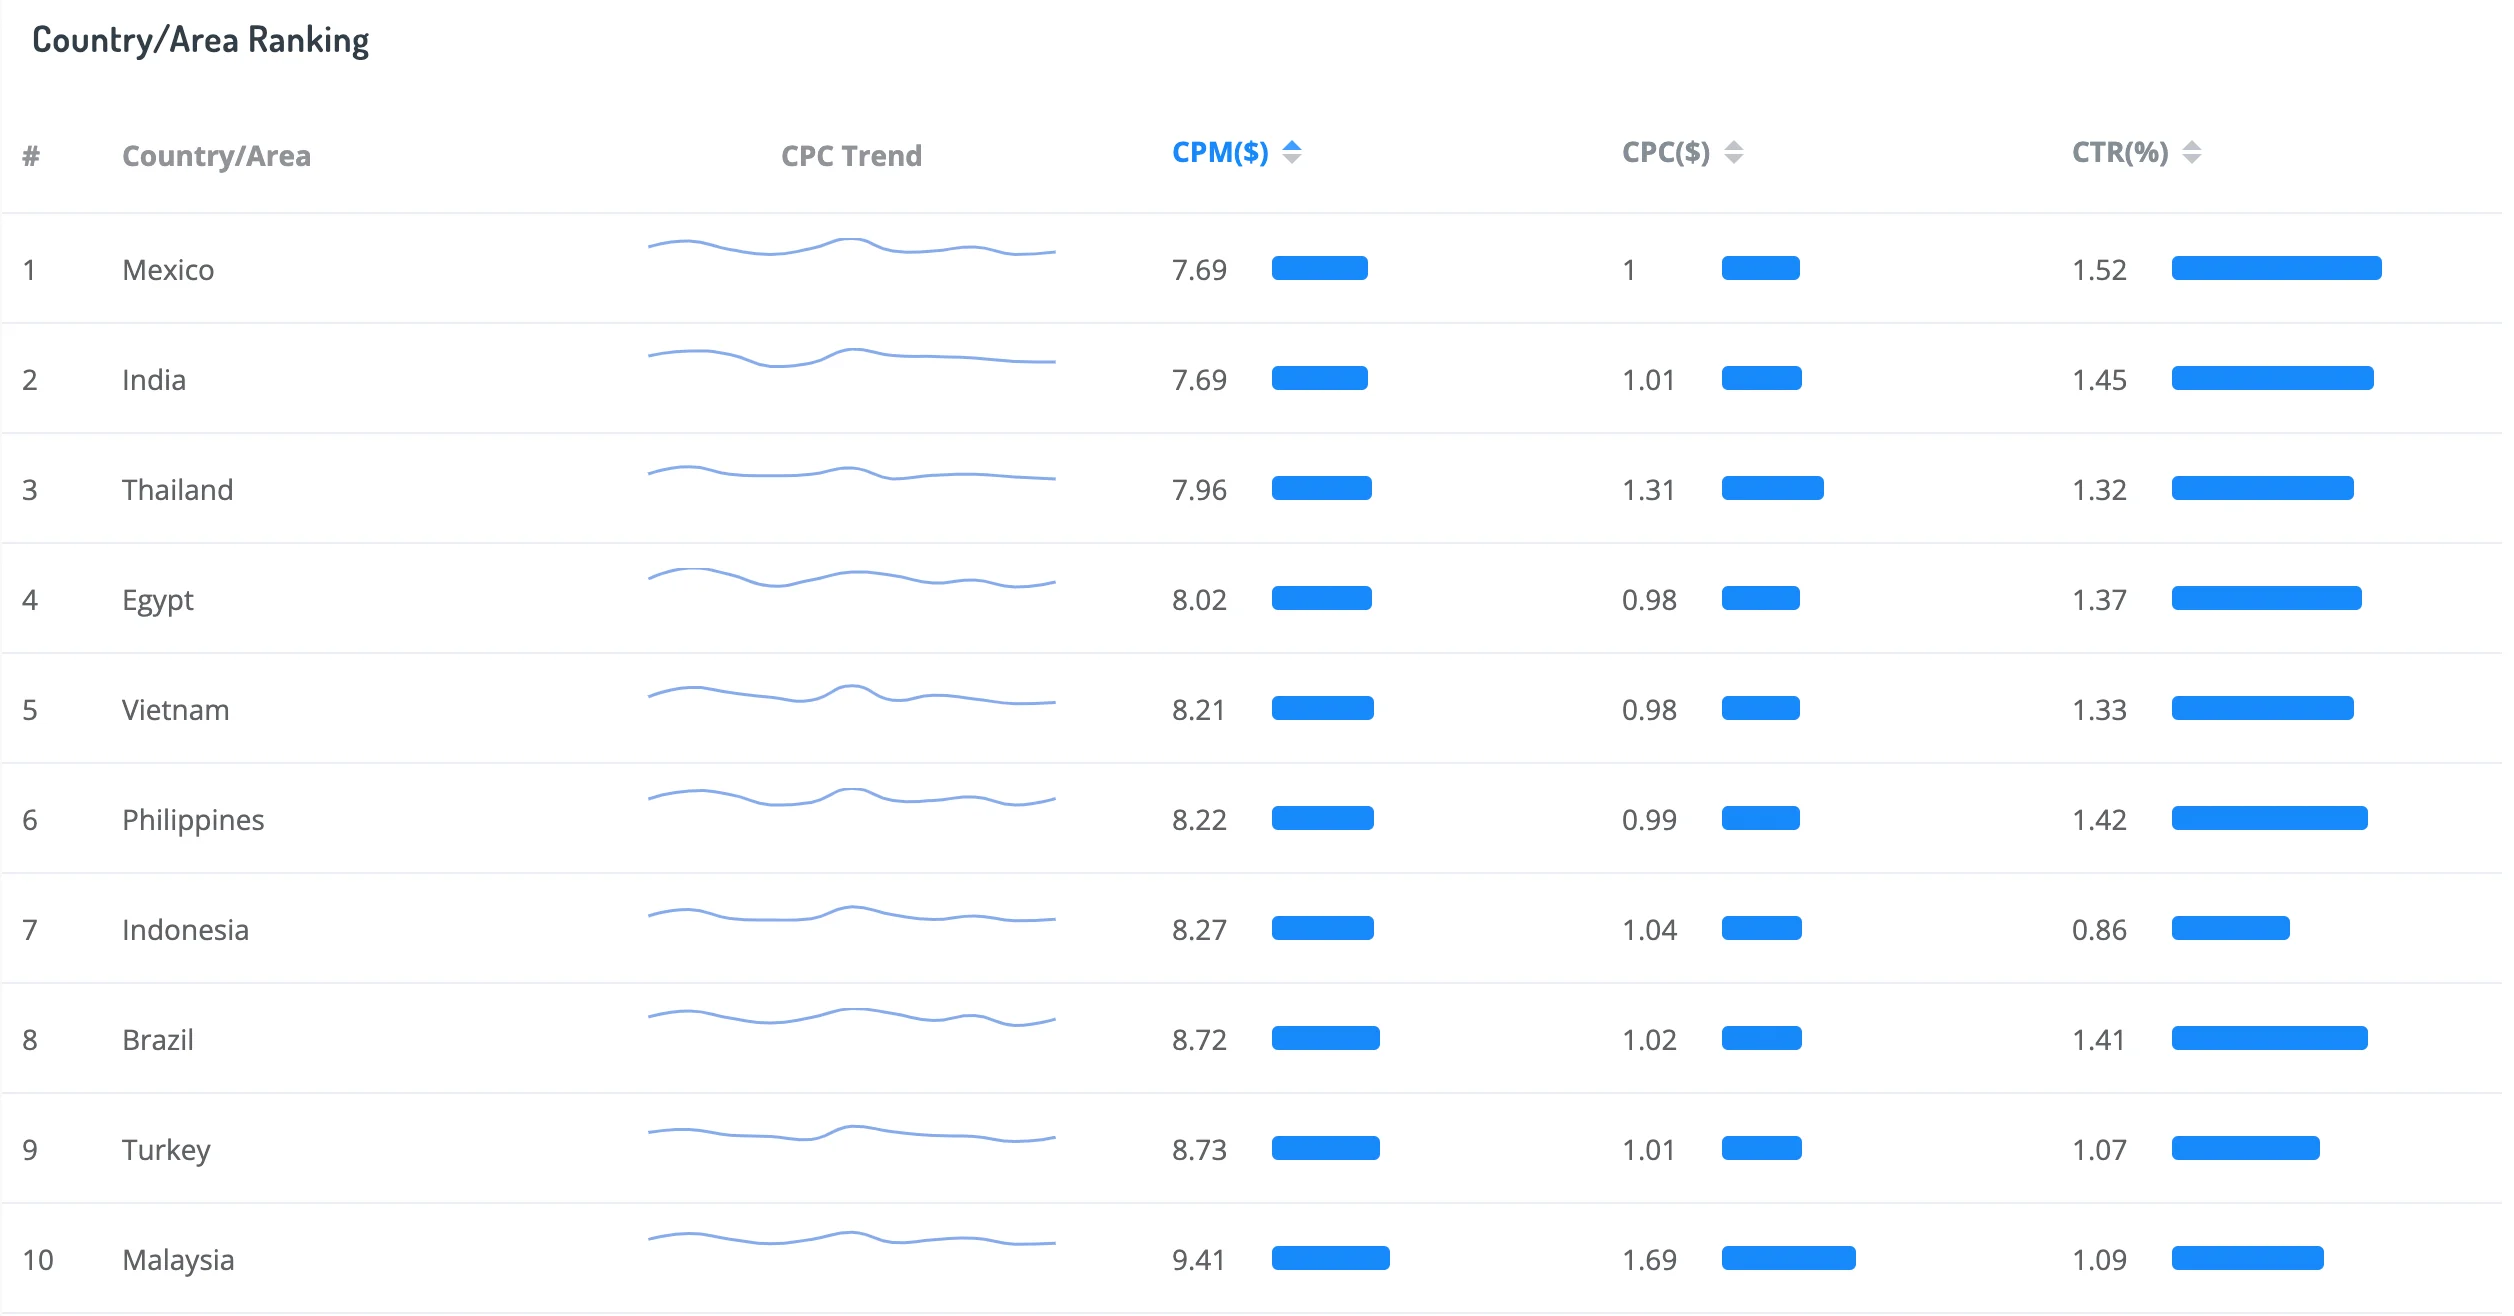
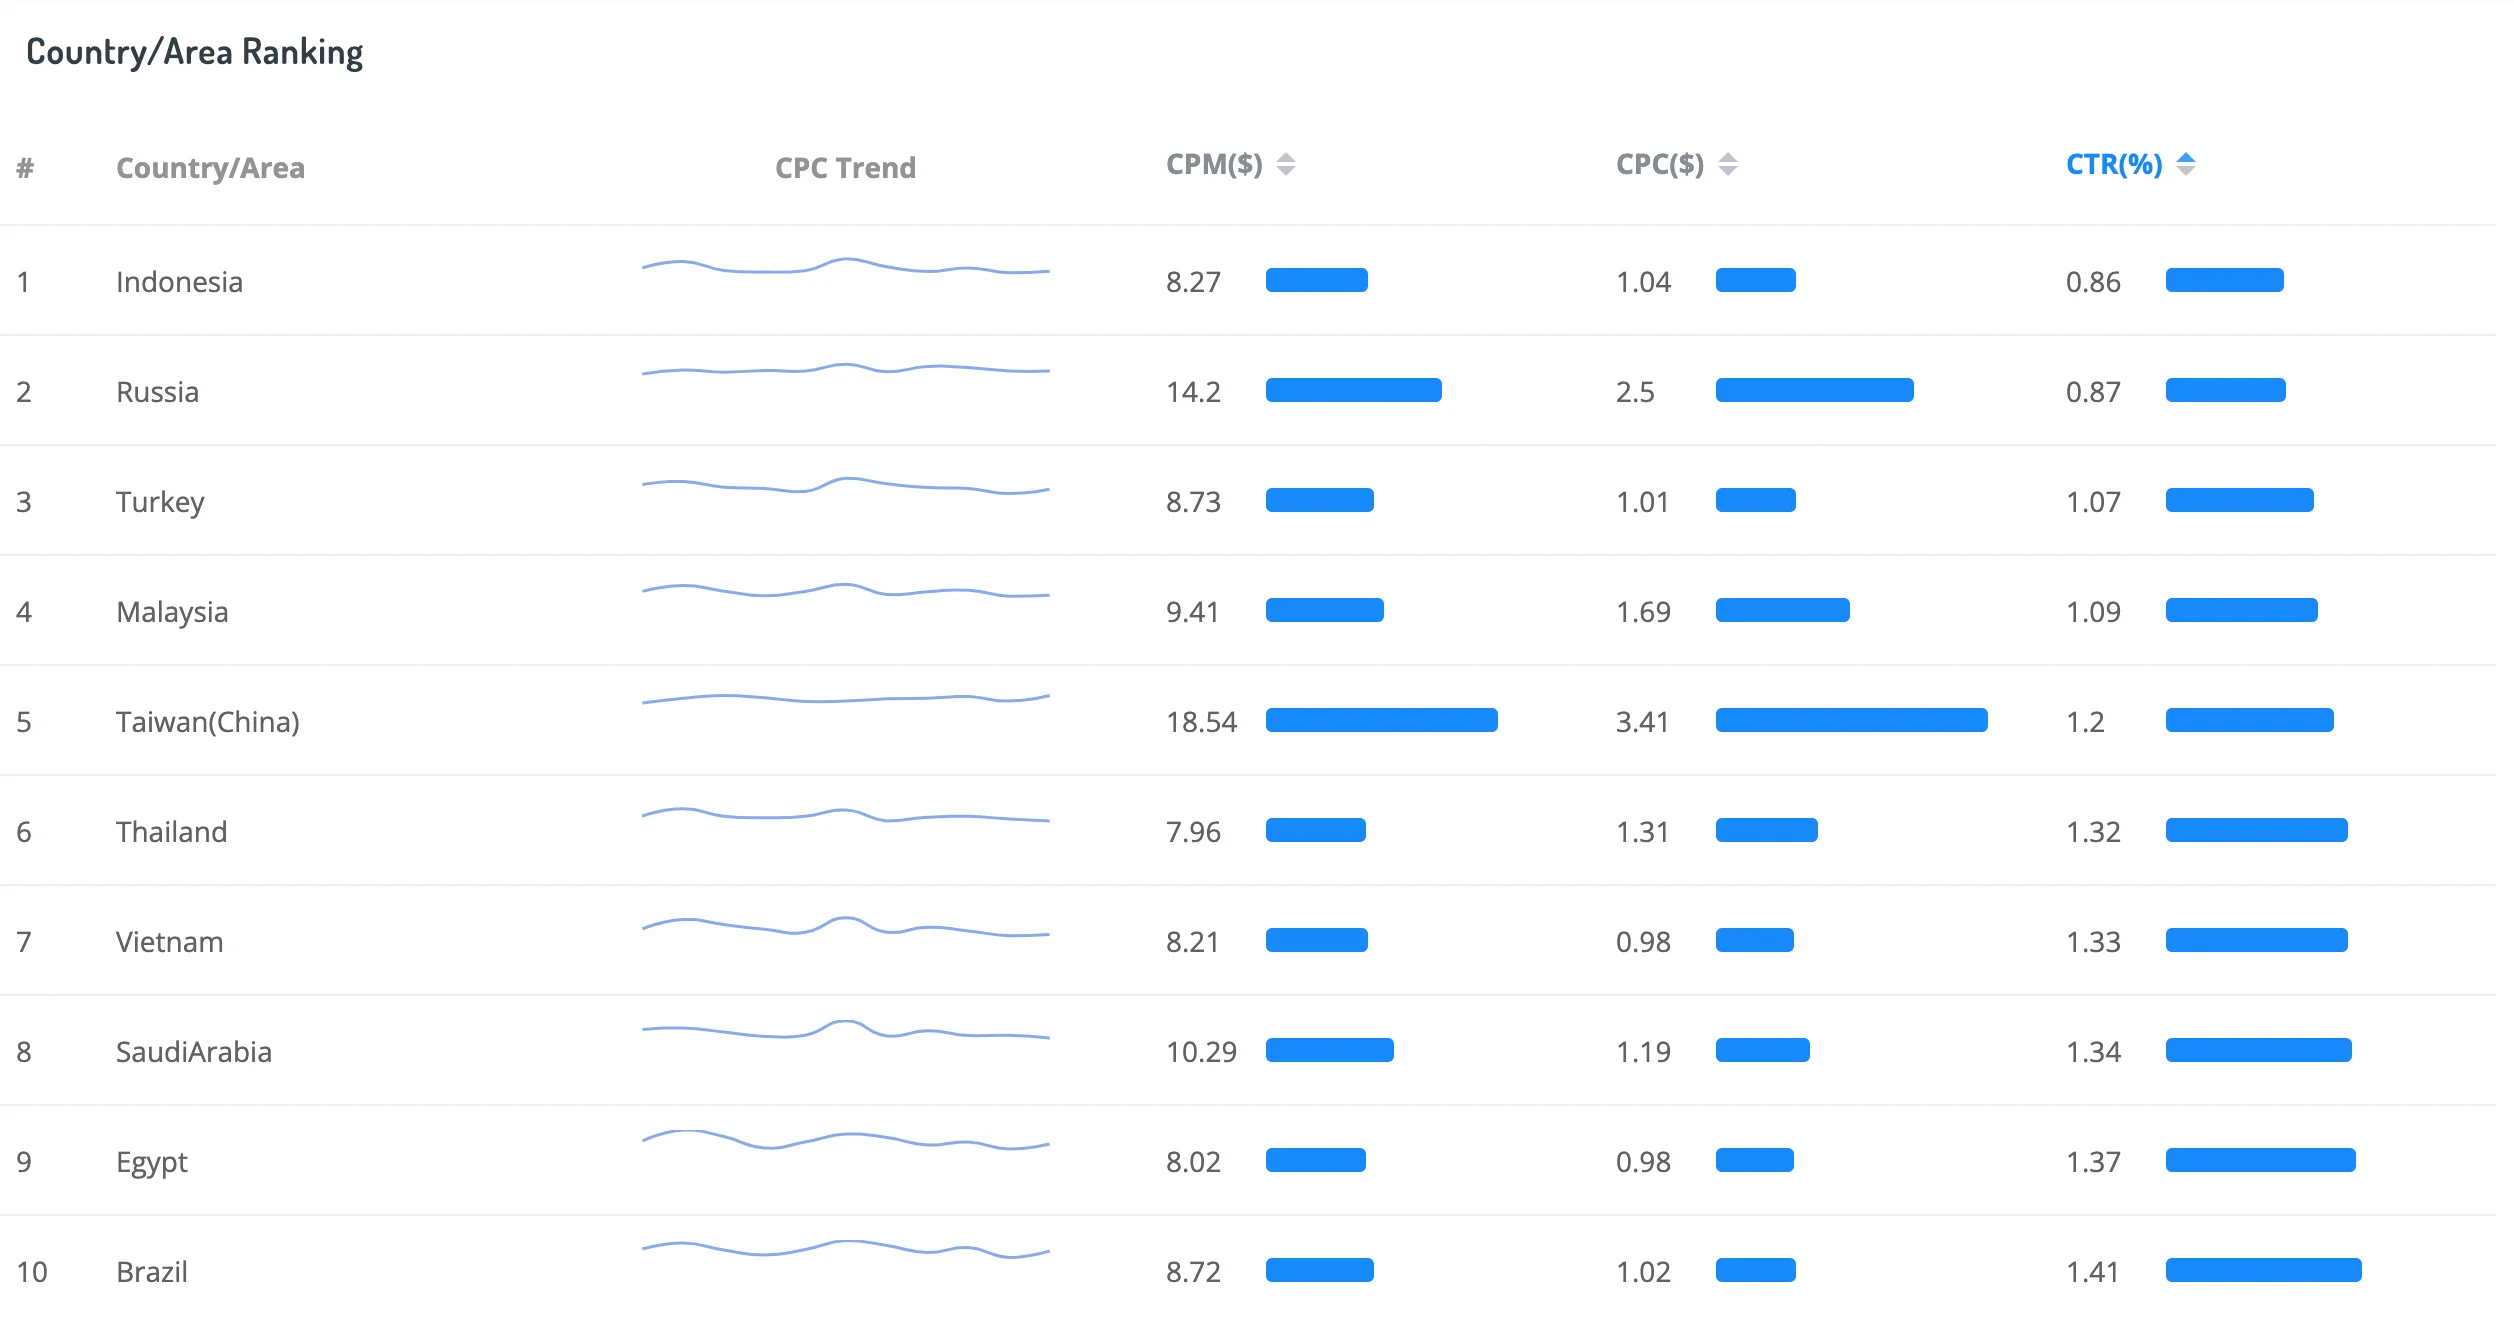
It is also interesting to consider countries with the lowest cost of advertising in the Gaming Apps category. Mexico, India, Thailand, Egypt, and Vietnam are leaders in this category.
As to the CPC indicator, these are Pakistan, Vietnam, Egypt, the Philippines, and Mexico.
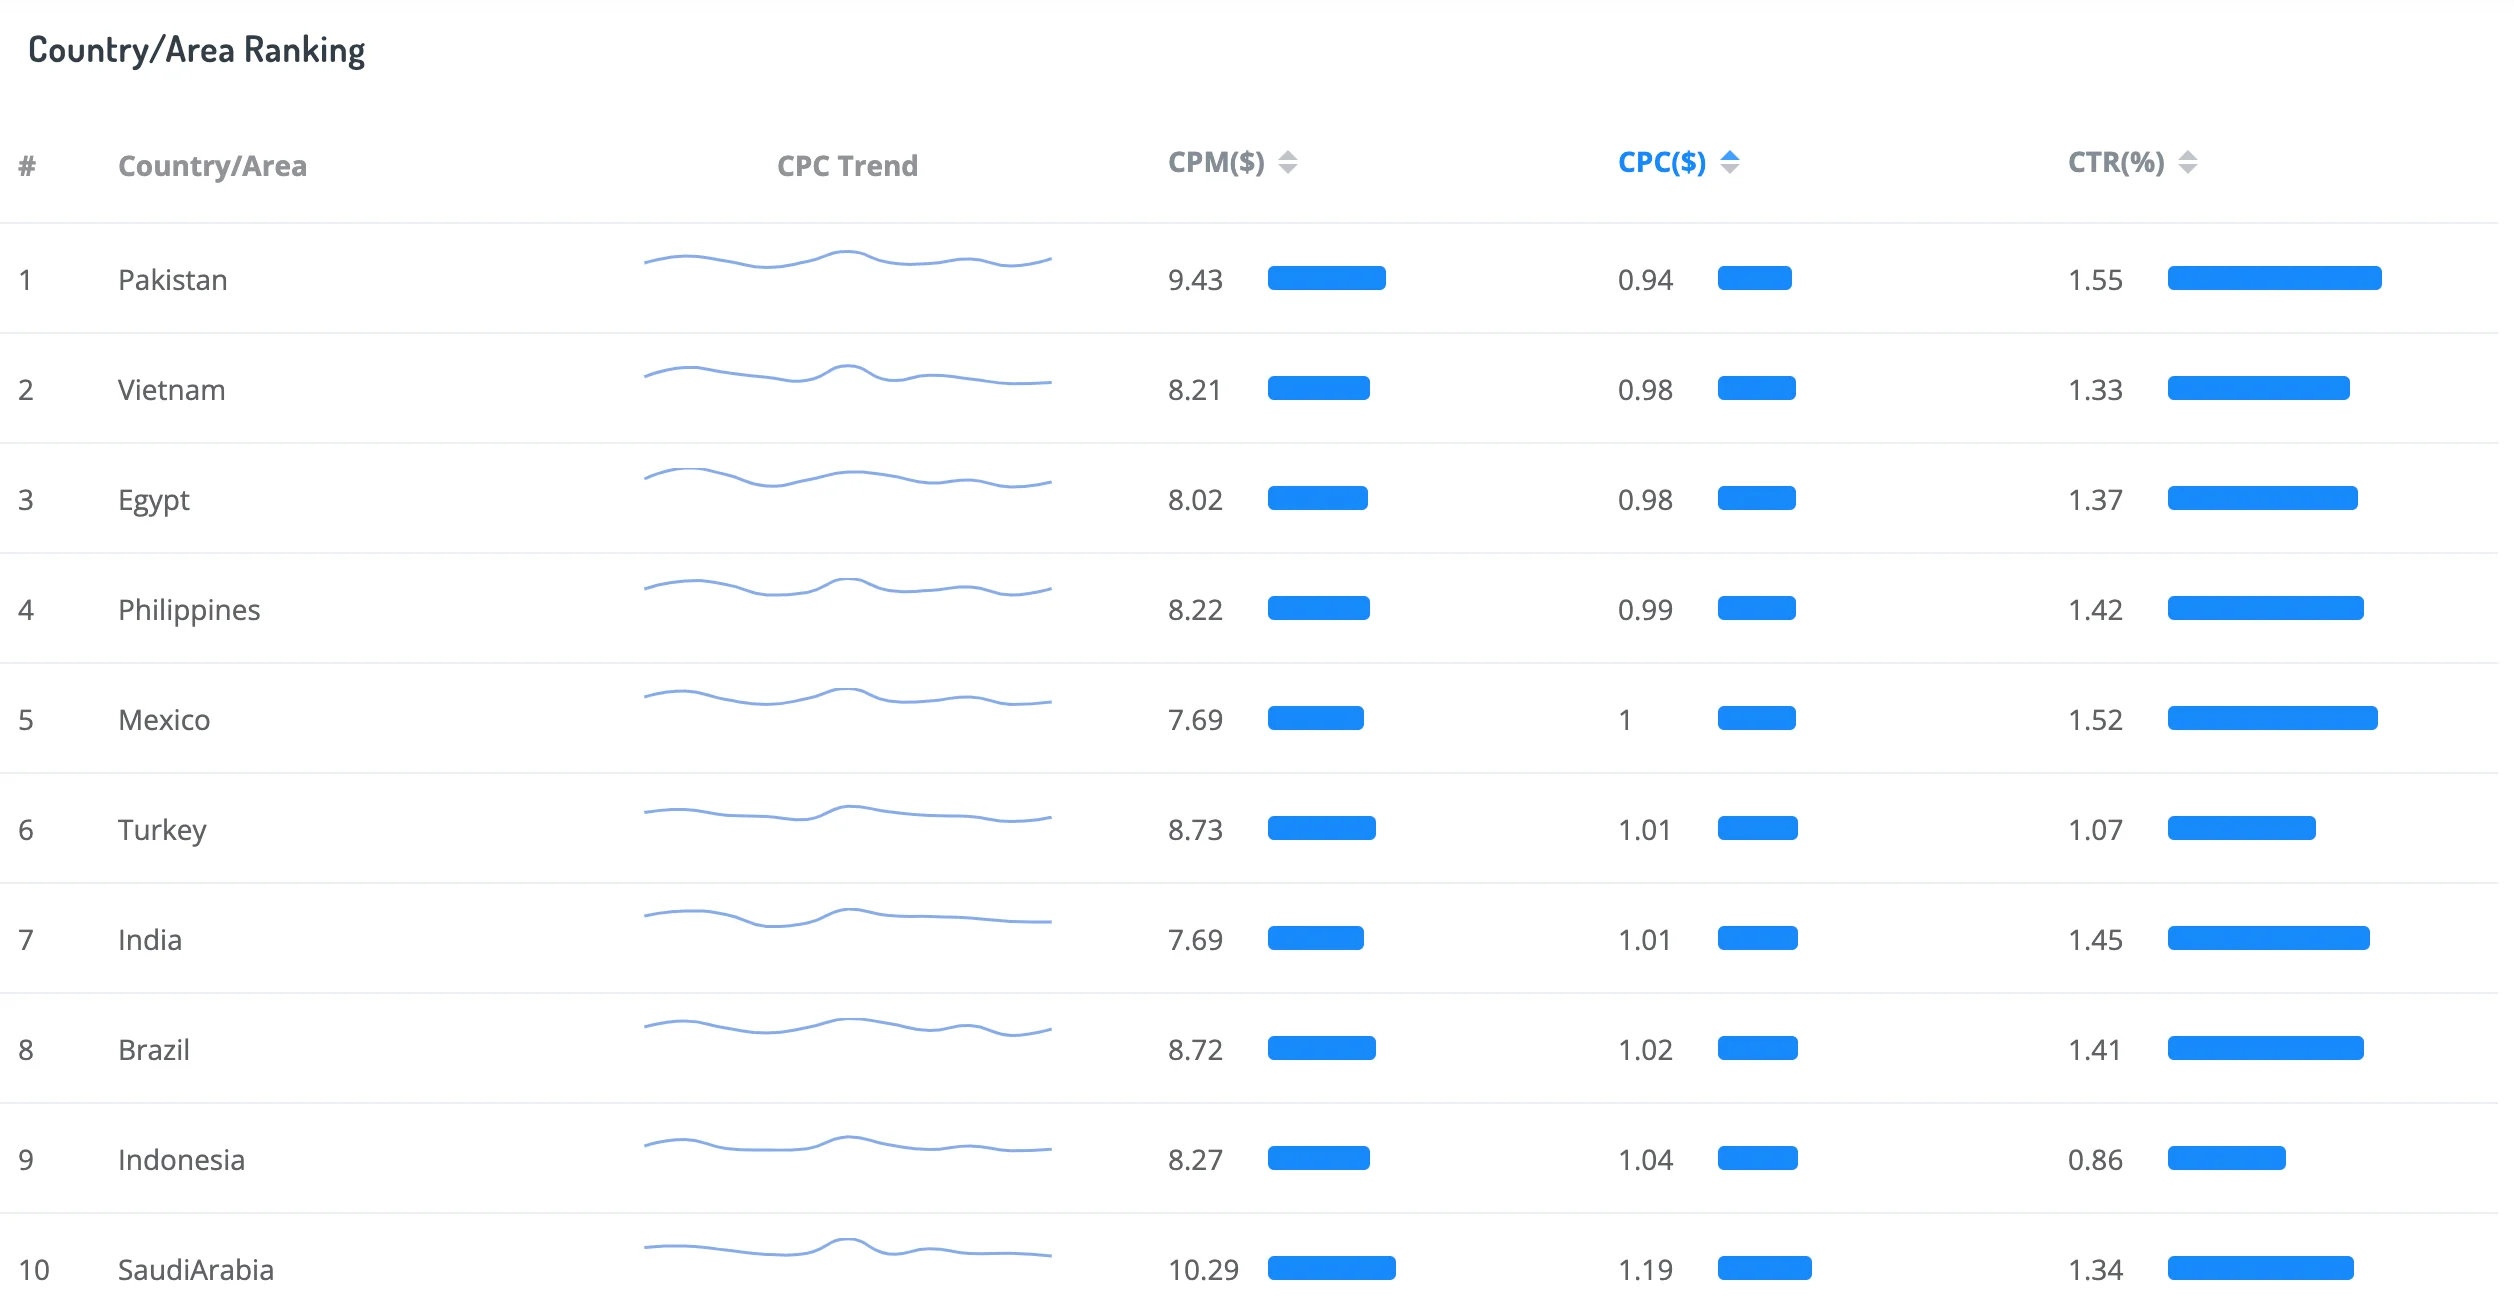
Indonesia and Russia, sadly, have the lowest CTR indicator.
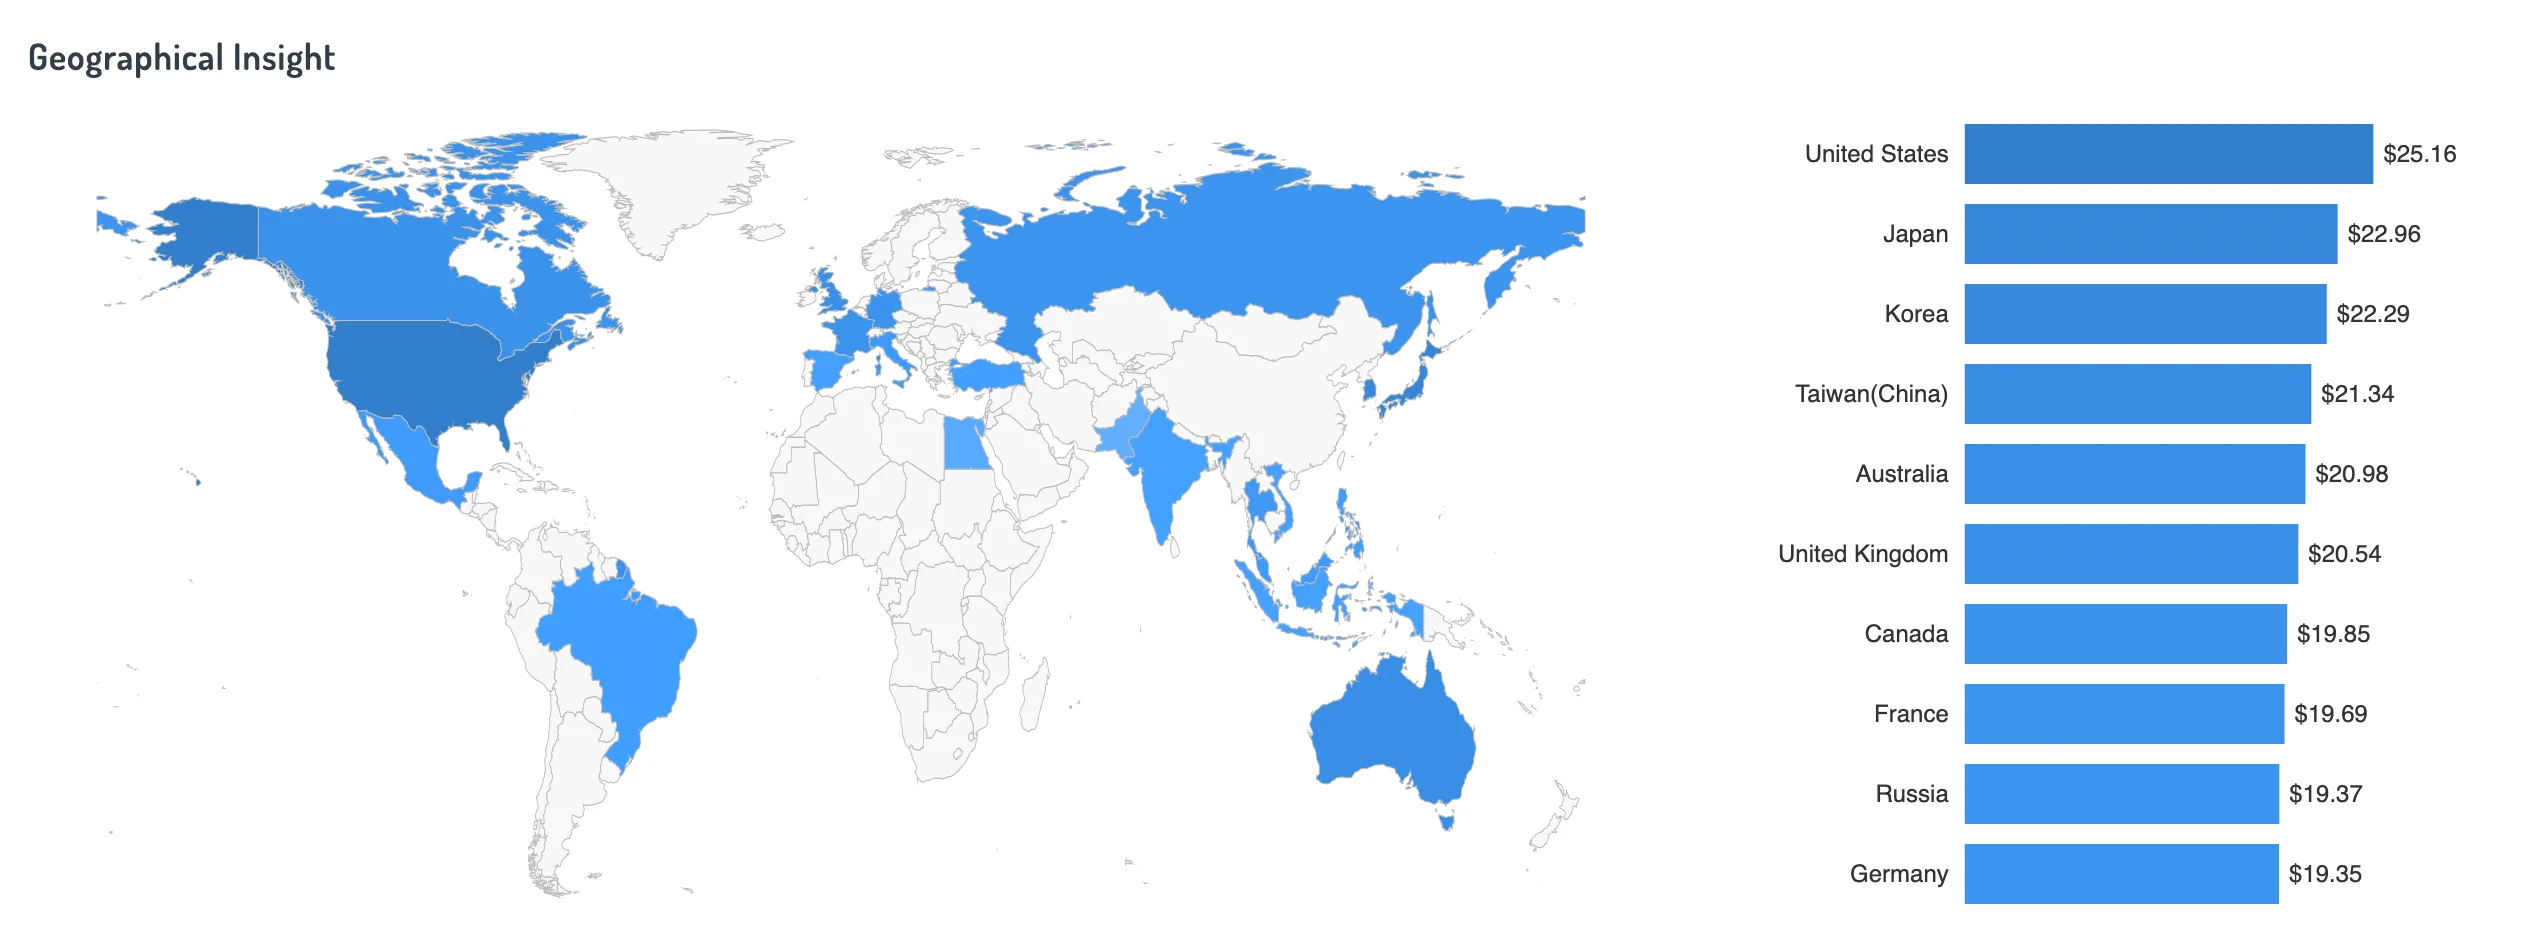
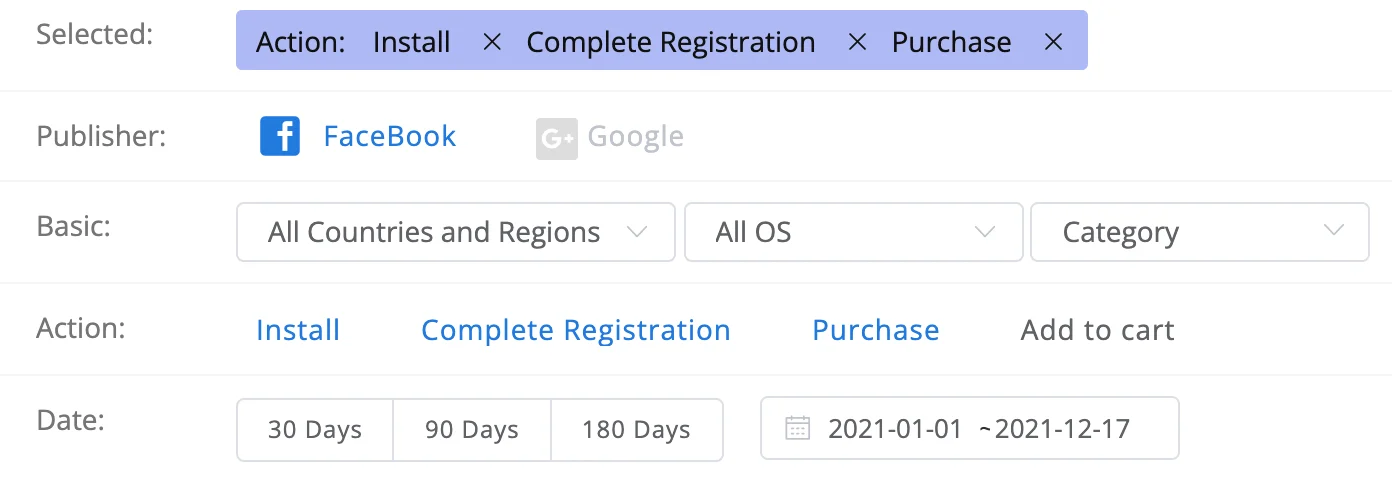
2021 Facebook Conversion Rate by Country
CR is calculated based on the following desired actions: installation, registration, and purchase in all categories.
2021 Dynamics
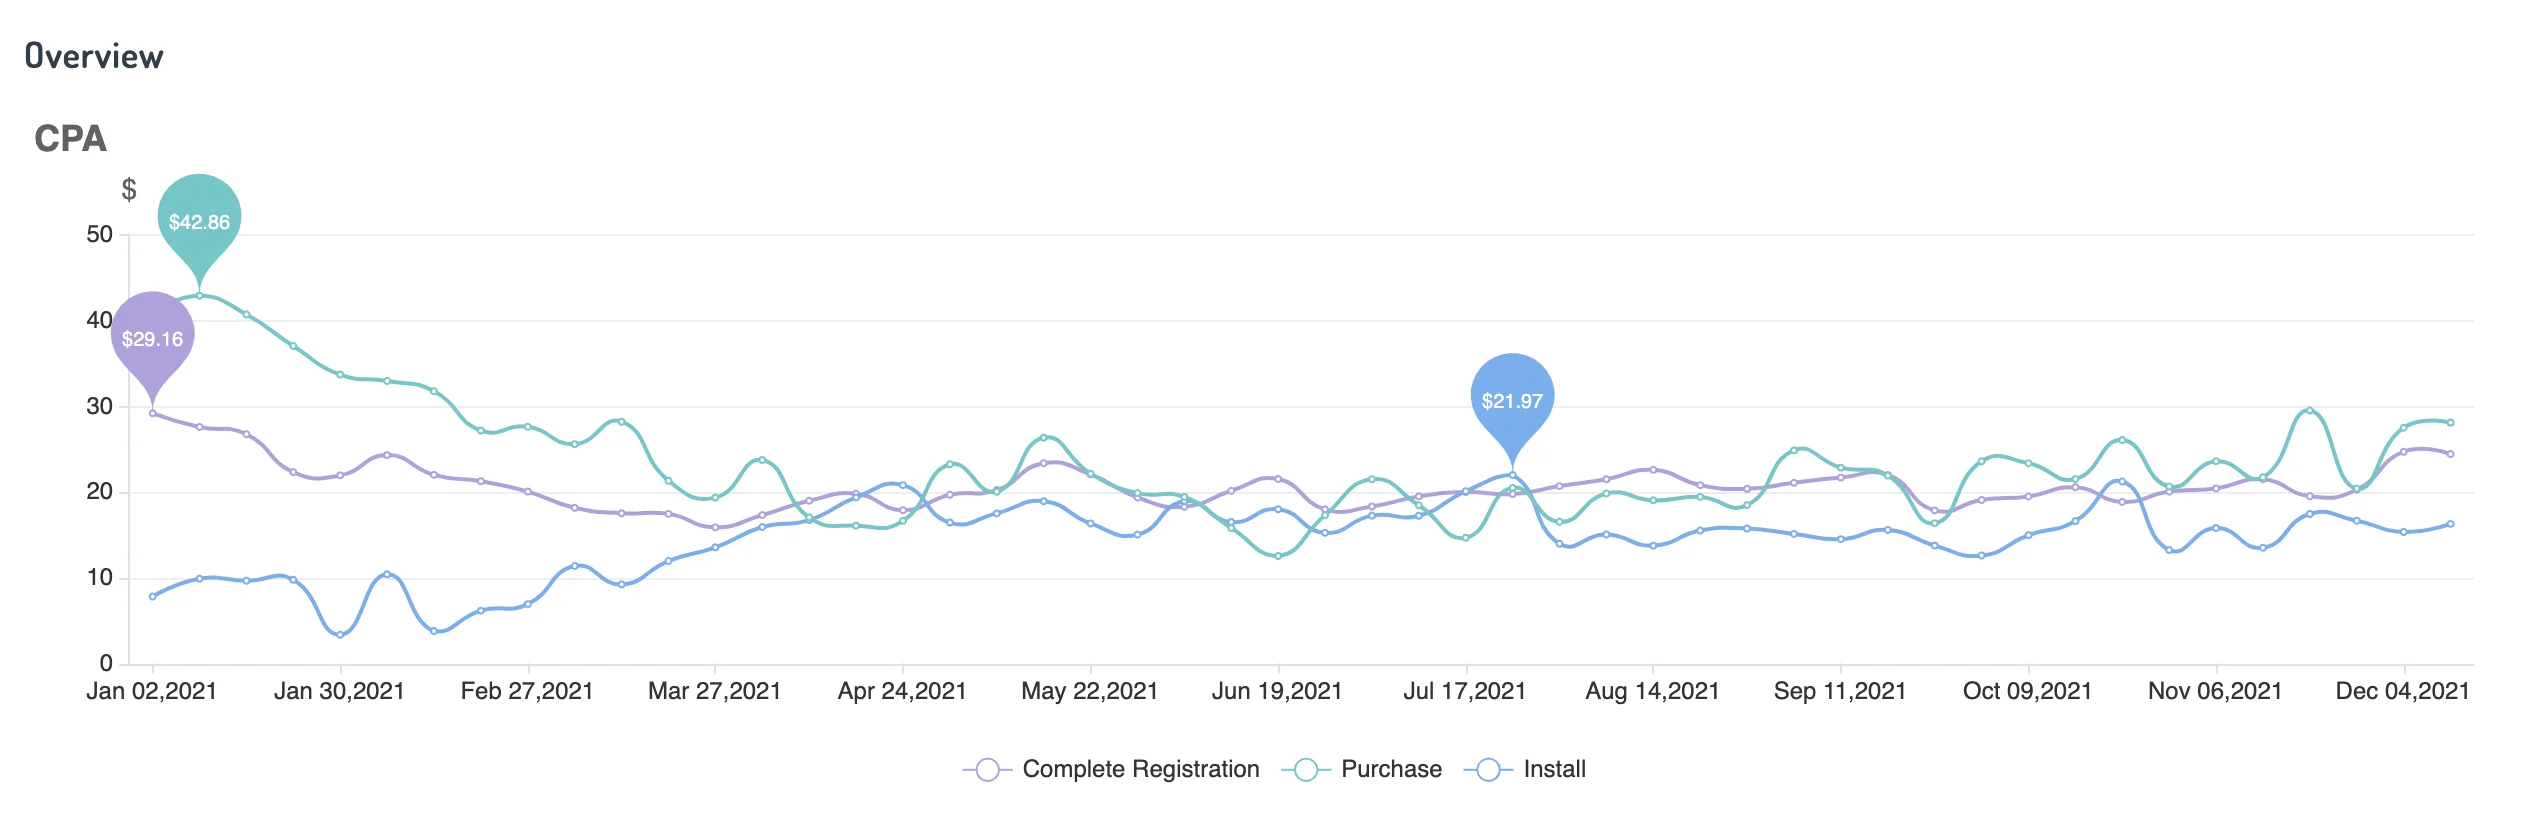
The top three countries in terms of CPA are the U.S. with an indicator of $25.16, Japan – $22.96, and Korea – $22.29. Russia occupies the ninth rating position with an indicator of $19.37.