Let’s look at two testing schemes for a bundle of landings, offers, and creatives, methods for calculating the minimum budget, and key metrics for analyzing the results.
Testing Scheme №1
In this scheme for each offer, all tested pre-landings with an order form are uploaded to a tracker or hosting. Some number of creatives for the test are created. Ads are launched for each offer and the best chain is selected: “Offer – Pre-Landing – Creative”. After that, the best combinations are run and the best one is selected.
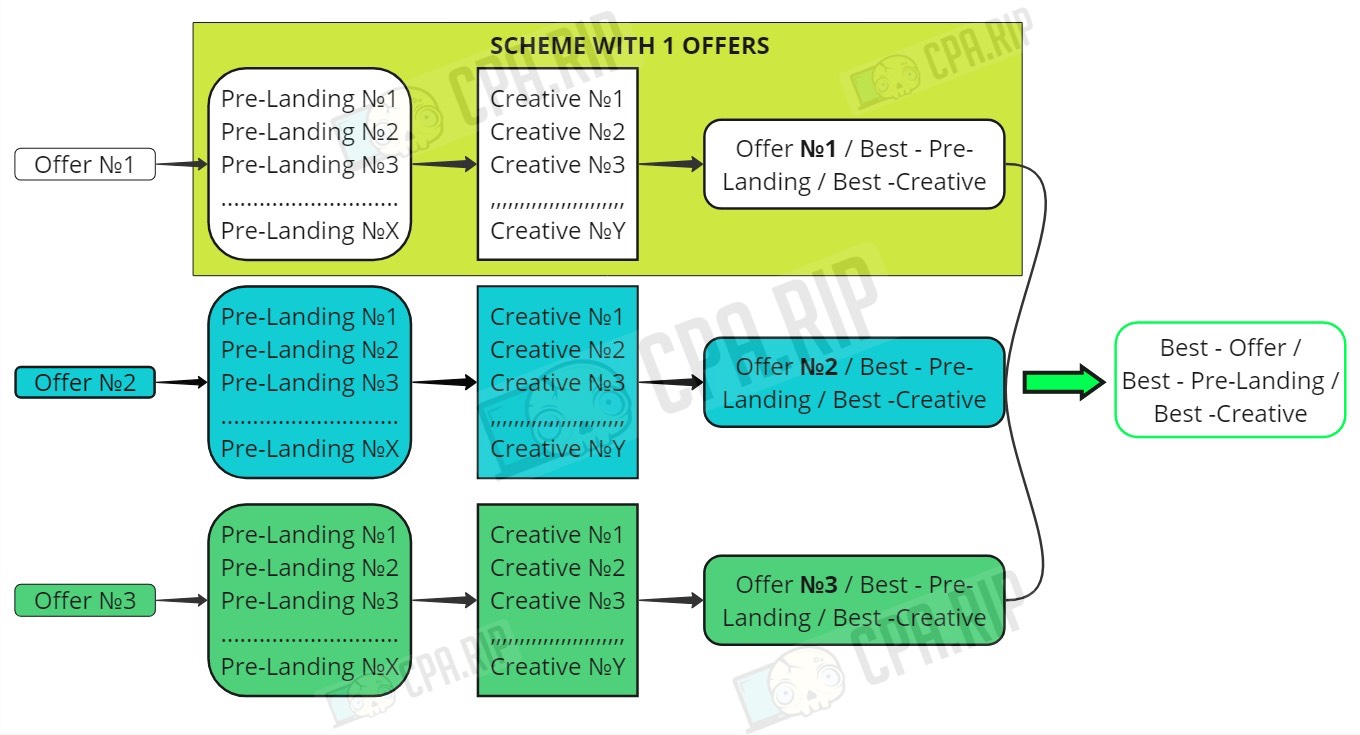
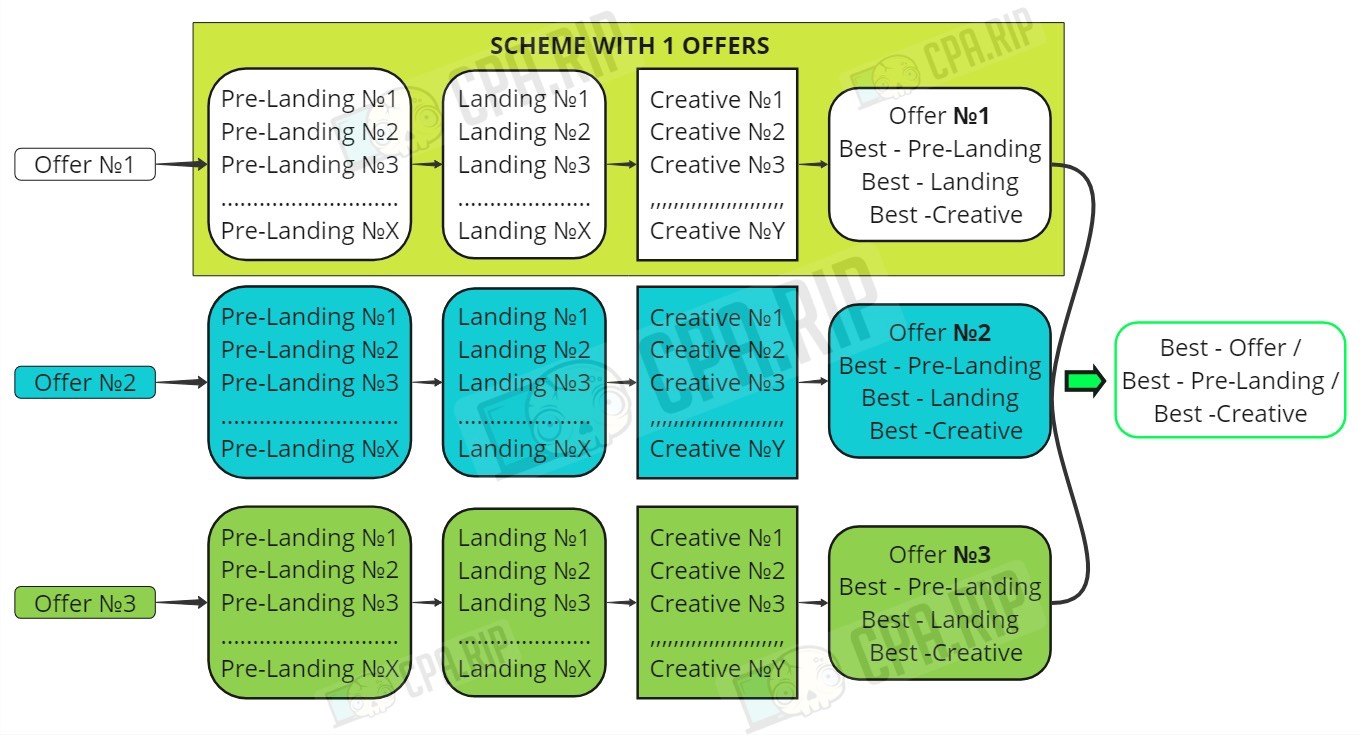
If the Pre-Landing + Landing scheme is used, another variable is added but the principle remains the same.
Testing scheme №2
For the second scheme the best combination “Pre-Landing – Creative” is found first of all, and after that Offers are added to this chain. Next the best combination “Offer – Pre-Landing – Creative” is found.
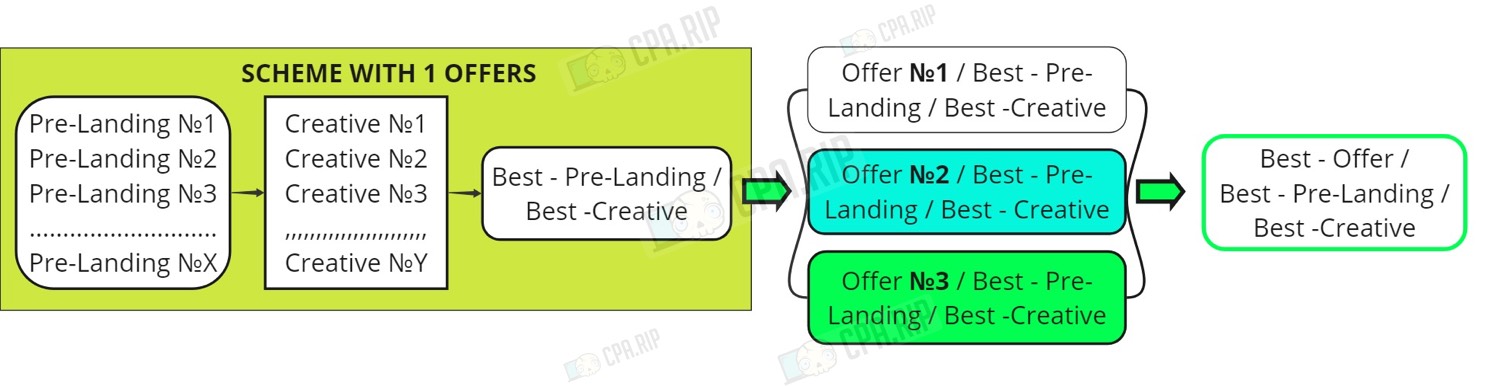
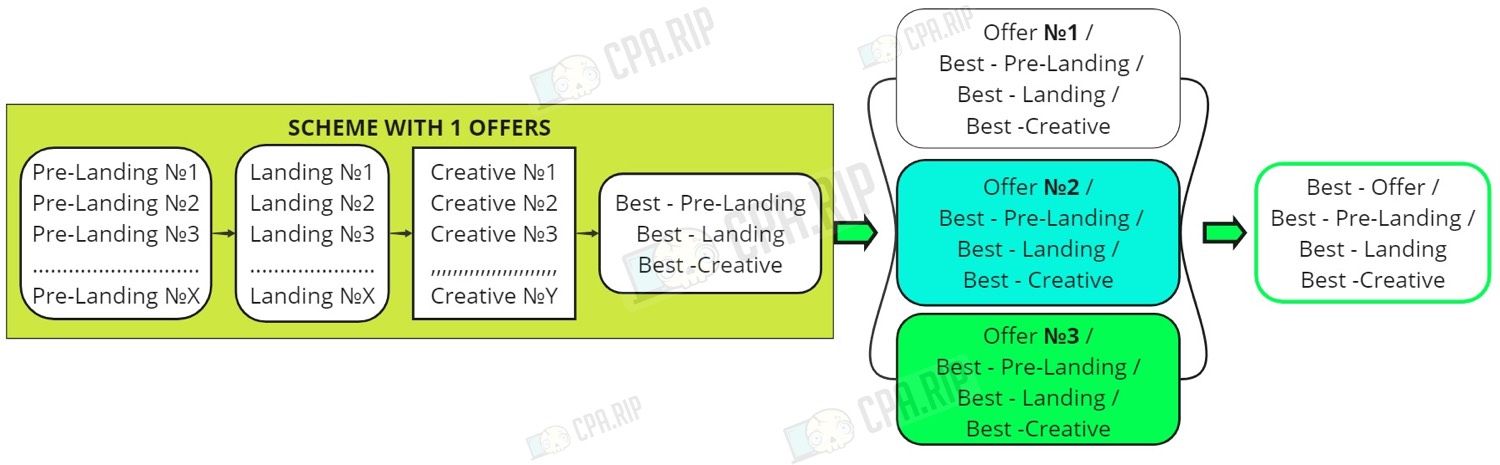
When using the scheme Pre-Landing + Landing, another variable is added but the principle remains the same.
Test Budget
To calculate the minimum budget to be spent on a test, three basic models are used.
- Model 1: 3 conversion costs are allocated to an advertising campaign. That is, if the conversion price is 18, then 18*3=54 for the test.
- Model 2. The model affects the amount of Pre-Landings/Landings, creatives used and is calculated based on EPL.
Budget = EPL * number of Pre-Landings/Landings * number of Creatives
For example: the payout on the offer is $20, the average approval – 25%, the number of Pre-Landings/Landings – 4, and the number of Creatives – 5. Then EPL = 20 * 0.25 = $5. The budget for the test is 5 * 4 * 5 = $100.
- Model 3. In this model, the budget is calculated based on price per click (CPC). On average, the traffic of 150-200 clicks is driven to Pre-Landing/Landing. If CPC = 0.05, then $7.5-$10 is spent on one landing page.
Analyzing results
To analyze the results you need to compare the main metrics, for Pre-Landing/Landing is CR (Conversion Rate). And for the overall “Landing – Creative” chain, it’s ROI (Return on Investment) and EPC (Earnings Per Click).
For ease of analysis, it is easier to build a report in the tracker. For this purpose, standard UTM tags are passed. The report is built based on parameters such as label and ad ID, if each ad is loaded with a unique creative. For convenience, you can add the name of the creative to the name of the ad and then look at the Ad Name parameter.
Finally, you can get a report that clearly shows the combination Pre-Landing – Creative.
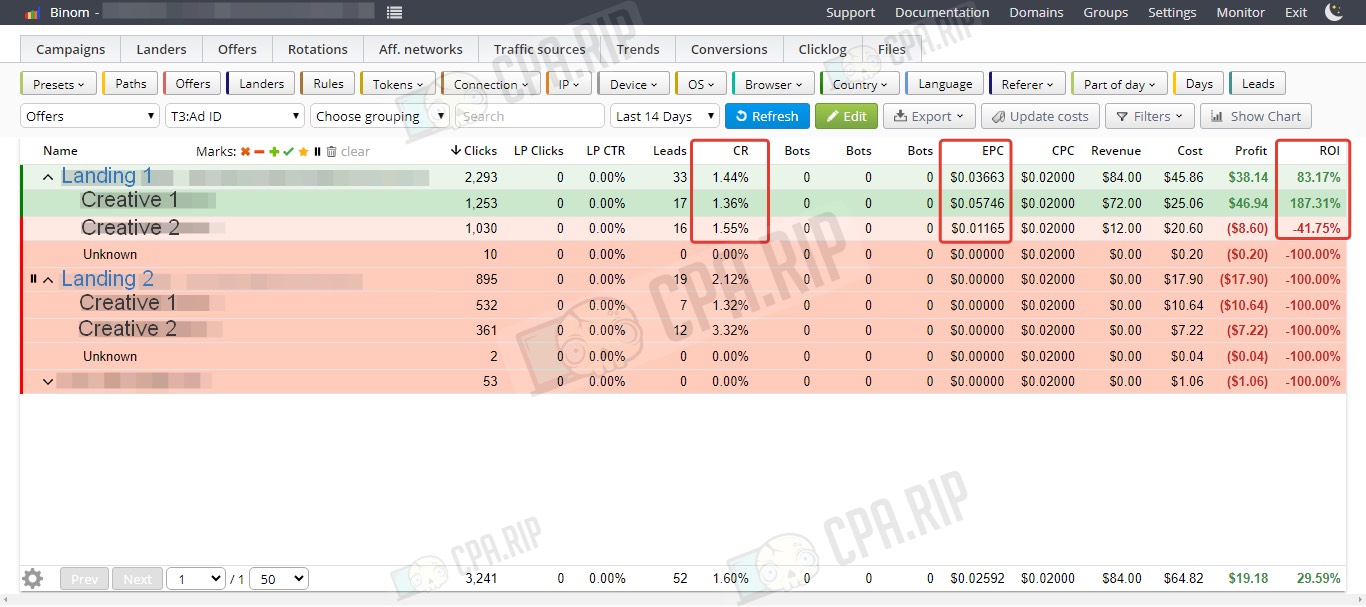
From this example, we can see that the combination of Landing1 – Creative1 is the best. EPC and ROI are higher than the others, although CR is one of the lowest. Thus, chains should first of all be compared by EPC and ROI, and then you can look at CR.