The new Digital 2026 Mid-Year Global Update Report contains data on the state of the digital environment as of April 2026: from the internet, mobile devices and social media to AI tools and digital marketing. We prepared a summary of the key data.
Among the most notable shifts is the sharp growth of AI tools such as ChatGPT and Gemini: their audience grew by 141% year over year and reached 2.42 billion active users. However, this figure in the report does not equal the number of unique people due to possible overlaps and duplication.
Another interesting signal is the growth of desktop traffic. Smartphones still lead, but their share declined by 17% year over year, while desktops and laptops grew by 30% and almost caught up with mobile devices.
The study was based on data from providers including: GWI, Statista, GSMA Intelligence, Semrush, SimilarWeb, Ookla, Skai. You can find the full Digital 2026 Global Overview Report presentation at the end of this article.
The state of digital technology in April 2026
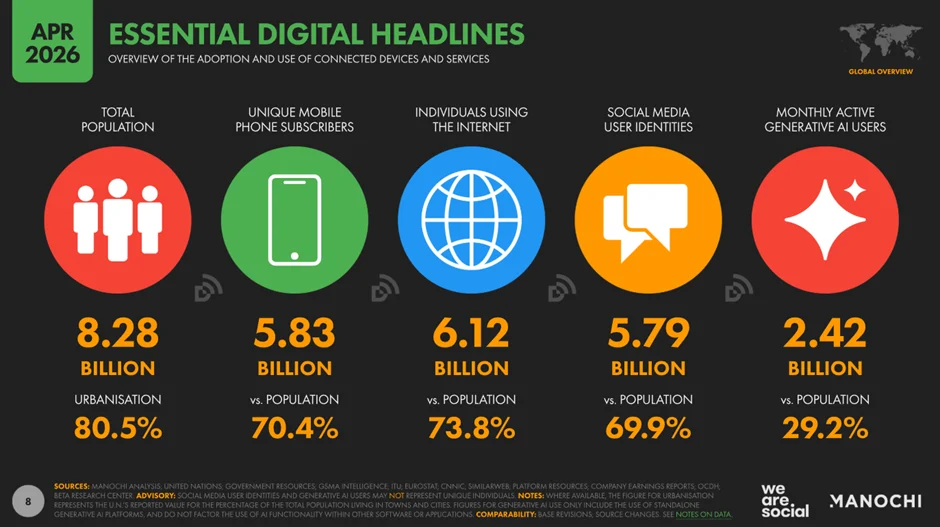
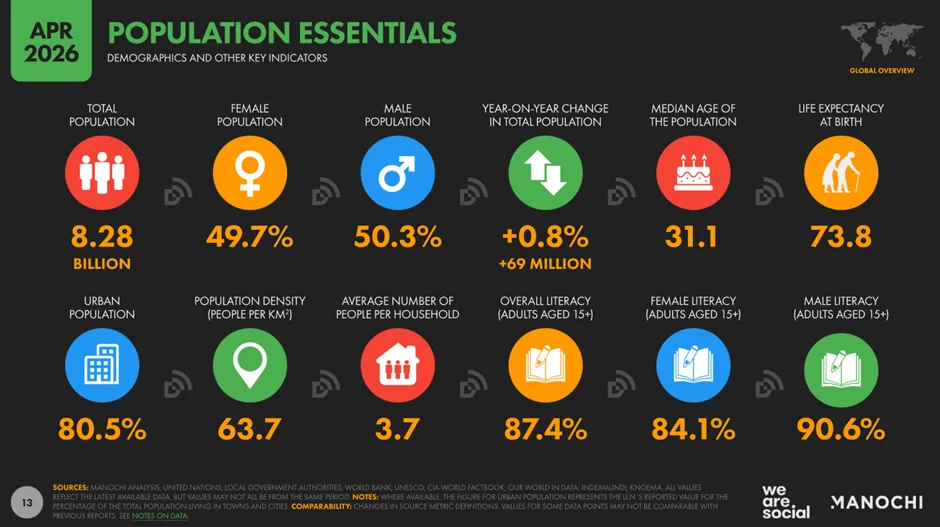
- The global population reached 8.28 billion people, with more than 80% of the population now officially classified as urban residents.
- The number of unique mobile users grew to 5.83 billion, while the share of smartphones among devices in use approached 90%.
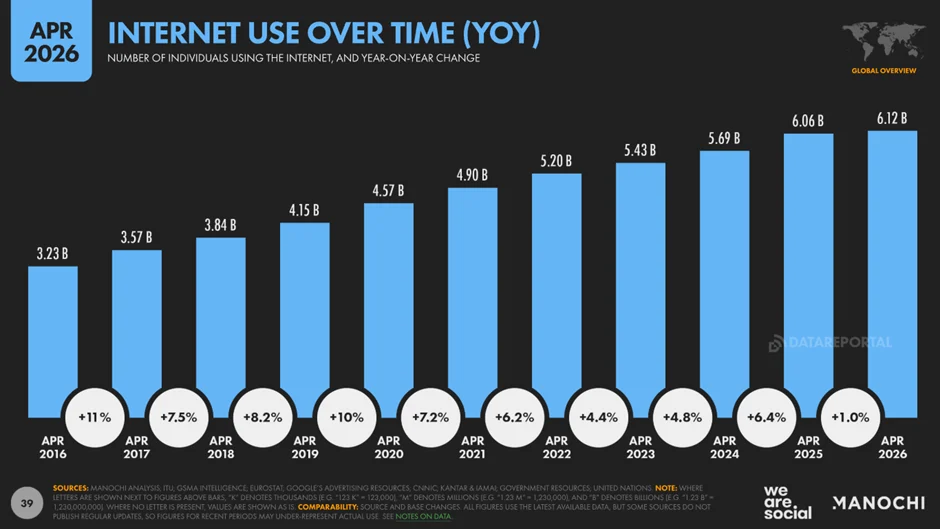
- The global internet audience reached 6.12 billion people, covering almost 74% of the world’s population.
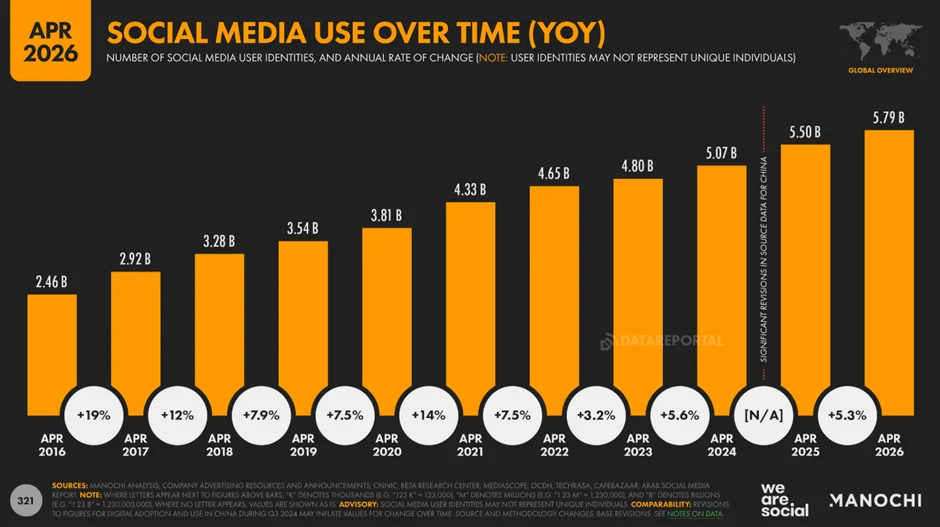
- The number of social media user accounts reached 5.79 billion, showing annual growth of 5.4%.
- The audience of tools such as ChatGPT increased by 141% year over year, reaching 2.42 billion active users.
Internet connection speed
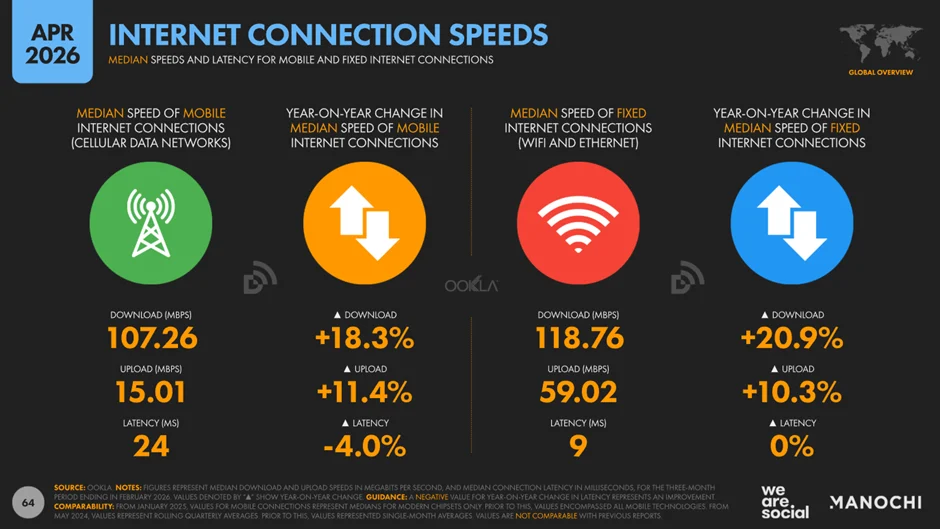
Global internet speed continues to grow: the average download speed in mobile networks reached 107.26 Mbps (+18.3%), while fixed networks reached 118.76 Mbps (+20.9%).
Demographics
- Population — 8.28 billion people (+69 million year over year).
- Men account for 50.3%, while women account for 49.7%
- Median age — 31.1 years, average life expectancy — 73.8 years.
Number of internet users
- The total number of users reached 6.12 billion people.
- Annual growth was +1.0%, or about 60 million new users over the year. Growth of 1% over the past year is the lowest figure in a decade.
Main reasons for using the internet
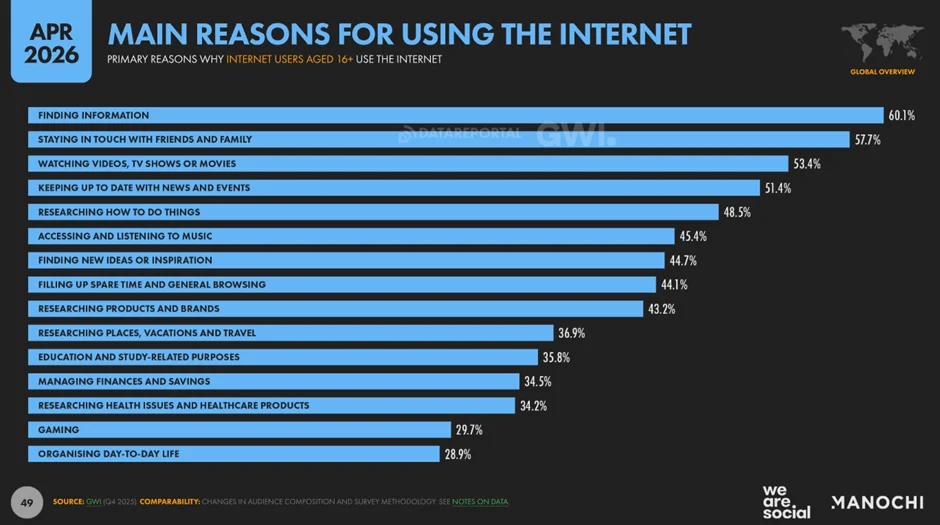
The average user pursues about 7-8 different goals at the same time.
- Finding information: 60.1%
- Staying in touch with friends and family: 57.7%
- Watching videos, TV shows and movies: 53.4%
- News and events: 51.4%
- Finding instructions (how to do something): 48.5%
- Listening to music: 45.4%
Popular online destinations
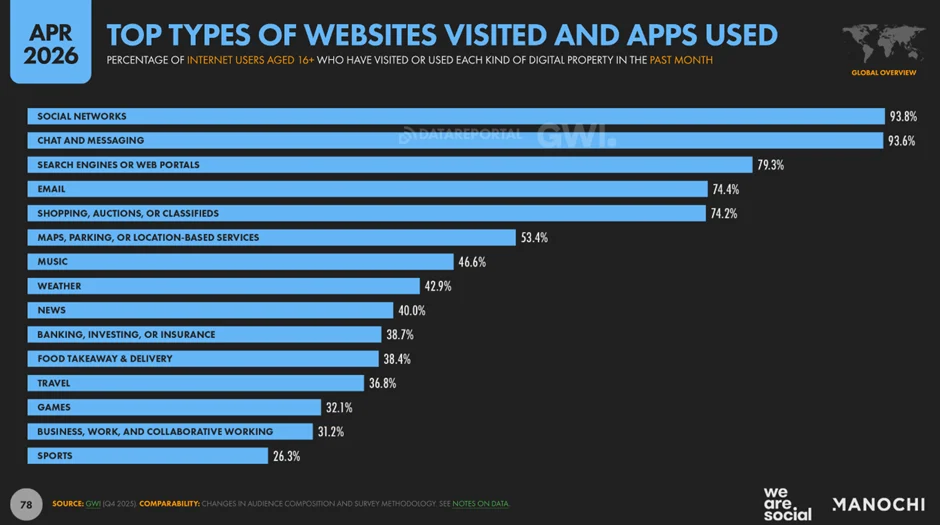
- Social networks and messengers cover almost the entire online population. 96.7% of respondents use at least one social network or messenger every month.
- Search engines and web portals rank third with 79.3%.
- Email is in fourth place with 74.4%.
- Shopping, auctions and classifieds are fifth with 74.2%.
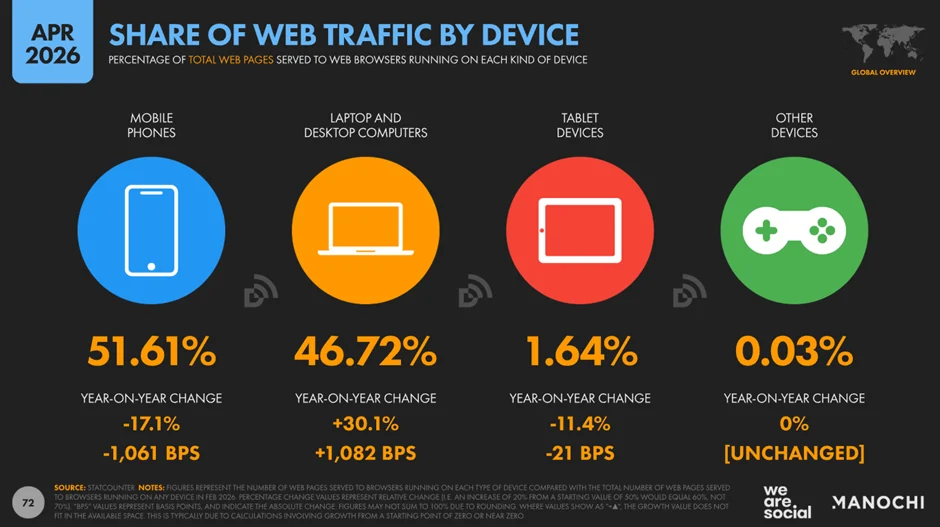
Structure of internet traffic
In 2026, desktops and laptops made an unexpected comeback, as users started returning to larger screens for working online.
- Mobile devices — 51.61%, still leading, but their share fell by 17% year over year.
- Computers — 46.72%, showing anomalous growth of 30% and almost catching up with smartphones.
- Tablets — 1.64%, continuing to lose popularity, down 11% year over year.
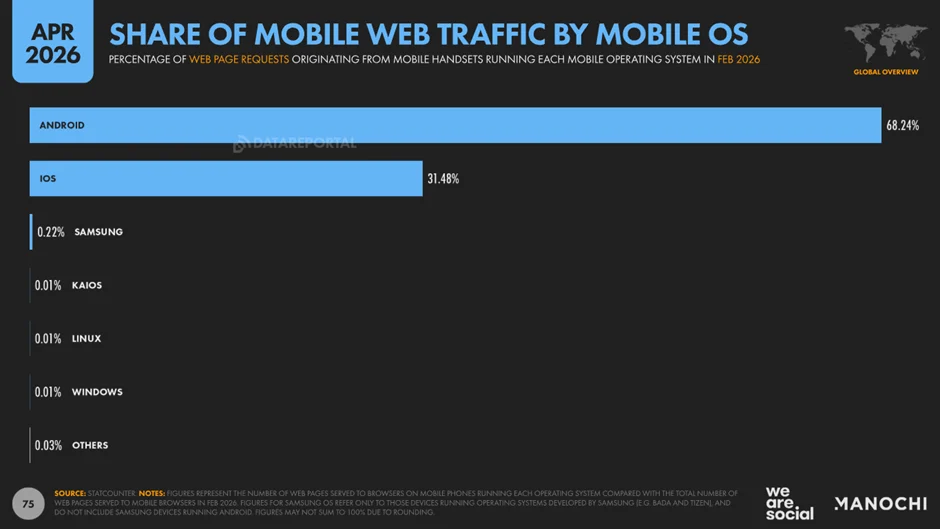
Mobile web traffic distribution by operating system
- Android — 68.24%.
- iOS — 31.48%.
- Others — less than 0.3%.
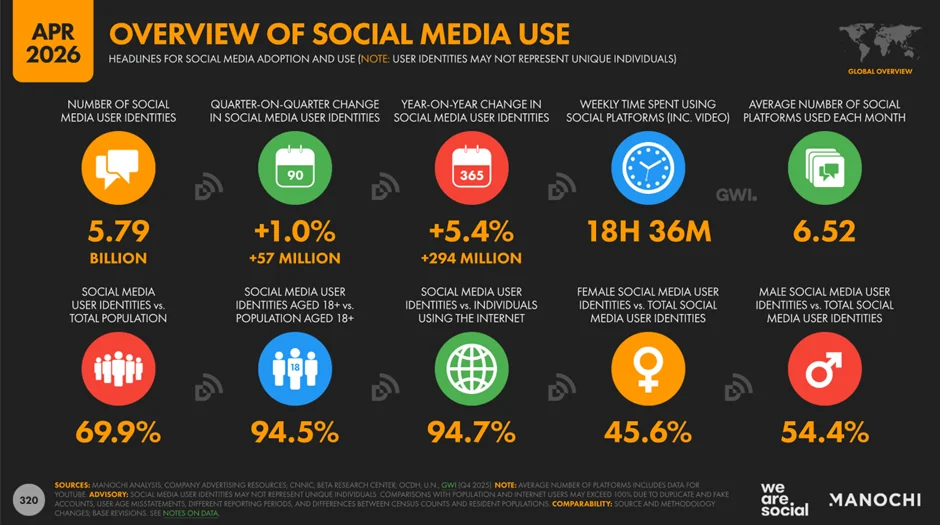
Social media users
As of April 2026, the social media audience reached 5.79 billion people, covering 94.7% of all internet users. The average user spends more than 18 hours per week on social media, while men prevail in the gender composition, 54.4% versus 45.6% women.
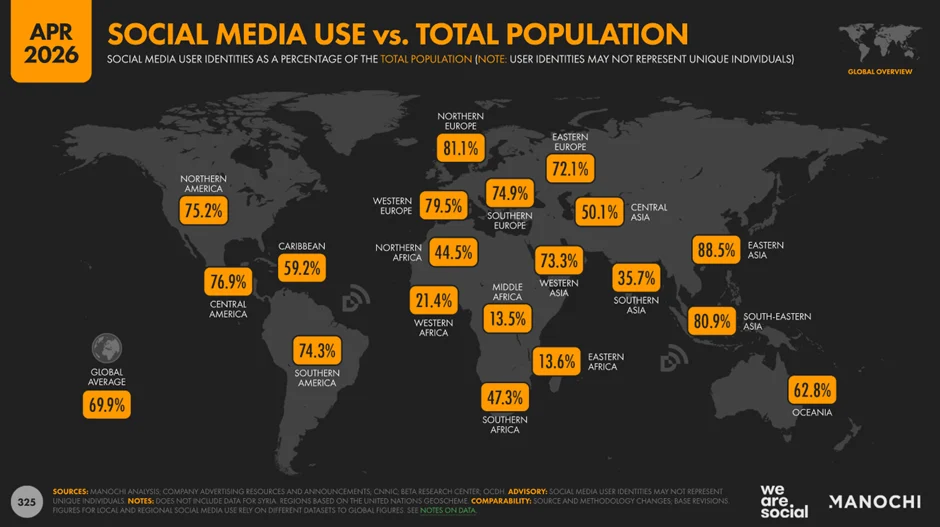
The global average social media penetration rate is 69.9%, but the geography of usage is highly uneven. The leaders are East Asia with 88.5%, Northern Europe with 81.1% and Southeast Asia with 80.9%, where social media covers the vast majority of the population. In the Americas and the rest of Europe, the figures are consistently high, ranging from 72% to 79%, while the lowest penetration remains in Africa, especially Central Africa at 13.5% and Eastern Africa at 13.6%.
Over the past 12 months, more than 800,000 new participants started using social media every day on average, equal to an average of 9.3 new users every second.
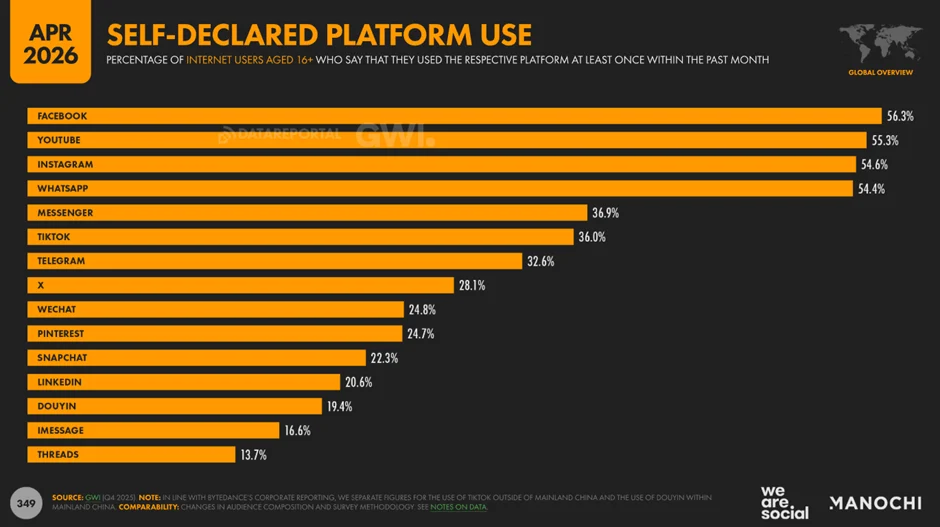
Facebook holds first place with 56.3%, followed by YouTube at 55.3%, Instagram at 54.6% and WhatsApp at 54.4%.
The second group is led by Messenger at 36.9% and TikTok at 36.0%, followed by Telegram at 32.6% and X at 28.1%.
The list is rounded out by WeChat at 24.8%, Pinterest at 24.7%, Snapchat at 22.3%, LinkedIn at 20.6%, Douyin at 19.4%, iMessage at 16.6% and Threads at 13.7%.
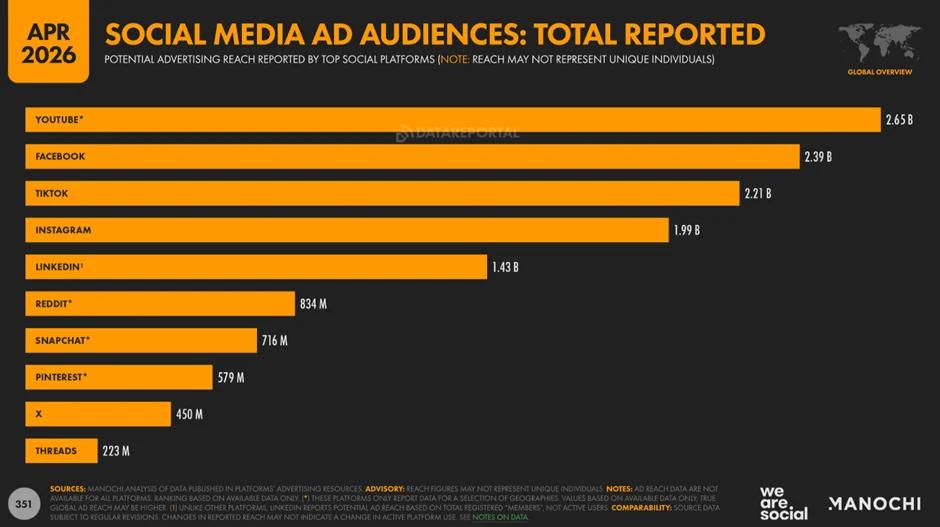
Social media advertising audience: adults 18+
By potential advertising reach, YouTube tops the list with 2.65 billion people, followed by Facebook with 2.39 billion and TikTok with 2.21 billion.
Instagram has come close to the 2 billion user mark, while LinkedIn shows 1.43 billion.
Reddit reaches 834 million, Snapchat 716 million and Pinterest 579 million potential advertising consumers.
X has a reach of 450 million, while Threads has 223 million.
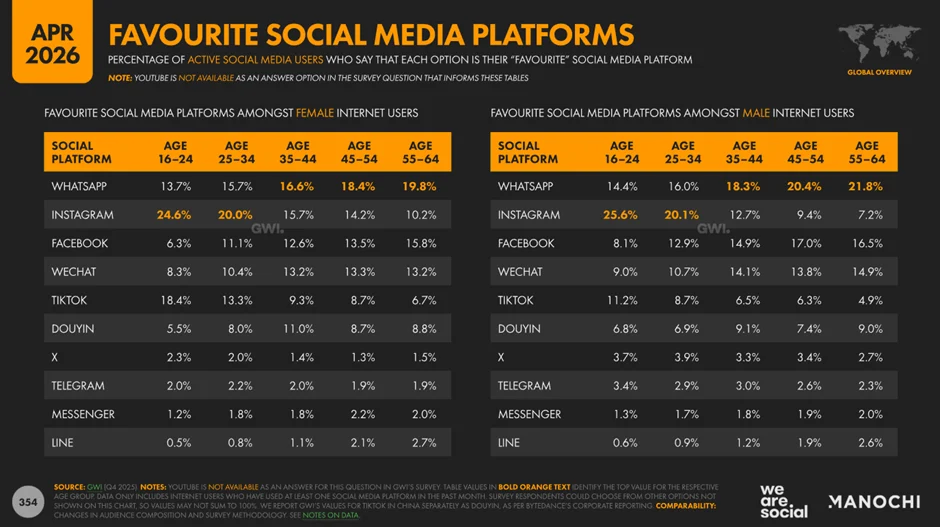
As of April 2026, WhatsApp leads in preferences among both genders, reaching peak popularity among men and women aged 55-64. Instagram remains the main favorite among young people, with its share among young men aged 16-24 higher at 25.6% than among women of the same age at 24.6%. At the same time, TikTok resonates significantly more with women aged 16-24, while Facebook and WeChat remain equally popular among men and women aged 35 to 64. Telegram maintains consistently low figures, although among men it is almost twice as popular as among women across all age groups.
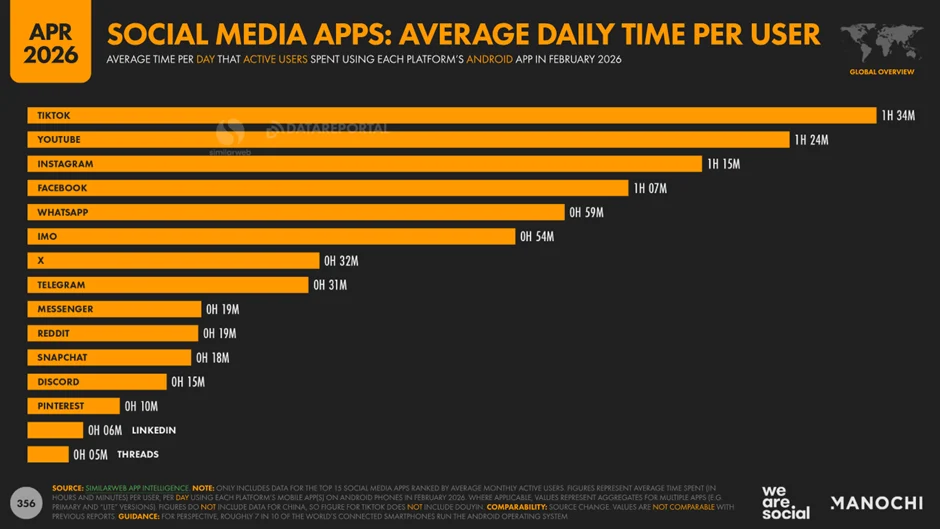
As of April 2026, TikTok leads in engagement among Android users, holding their attention for 1 hour and 34 minutes per day. YouTube, Instagram and Facebook also remain in the top group with results of more than an hour, while X and Telegram account for only about half an hour.
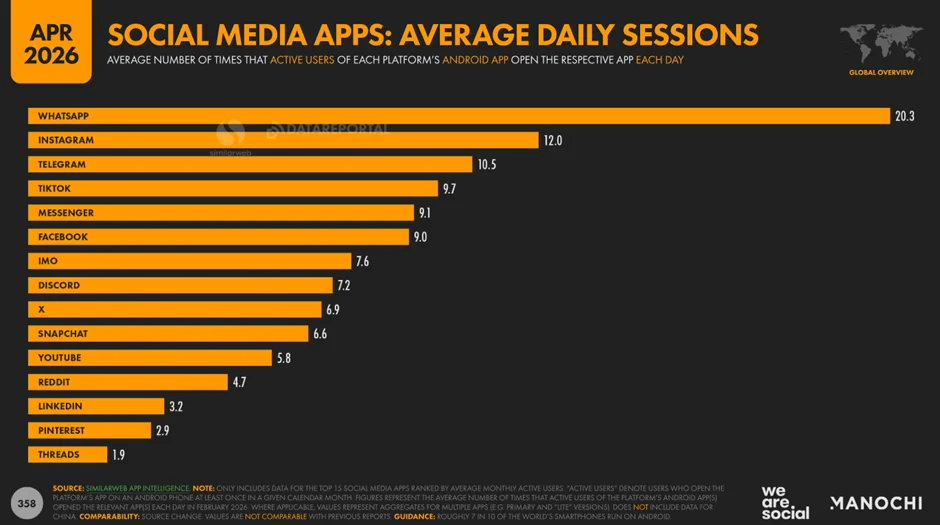
Average number of daily sessions
WhatsApp remains the absolute leader in usage frequency: active Android users open it an average of 20.3 times per day. Instagram also shows strong habit formation with 12 sessions, and Telegram with 10.5 sessions daily. TikTok and Facebook are opened less often, about 9-10 times, which, combined with time spent data, indicates longer but less frequent sessions.
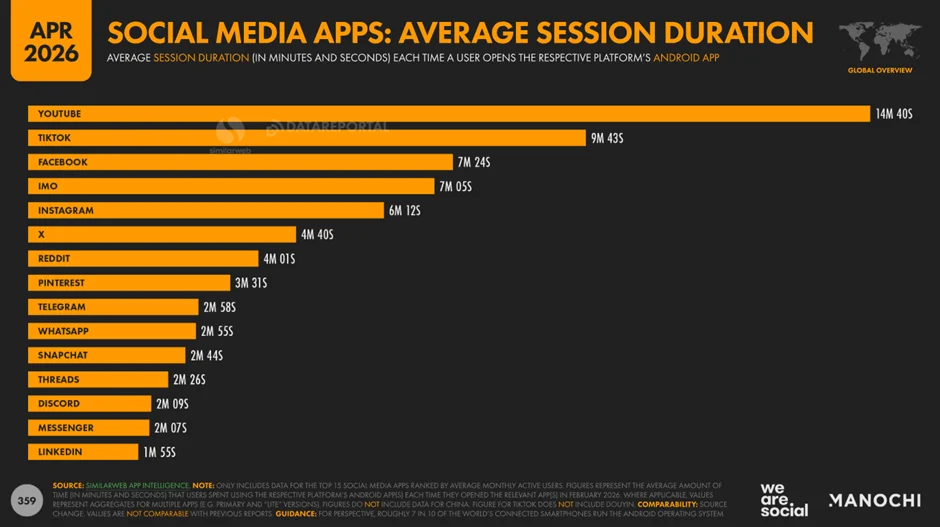
Average session duration
YouTube confidently leads by average session duration: Android users spend 14 minutes and 40 seconds in the app per visit. TikTok and Facebook also hold attention for a long time, at 9 minutes and 43 seconds and 7 minutes and 24 seconds respectively. Messengers Telegram and WhatsApp show much shorter sessions, about 3 minutes.
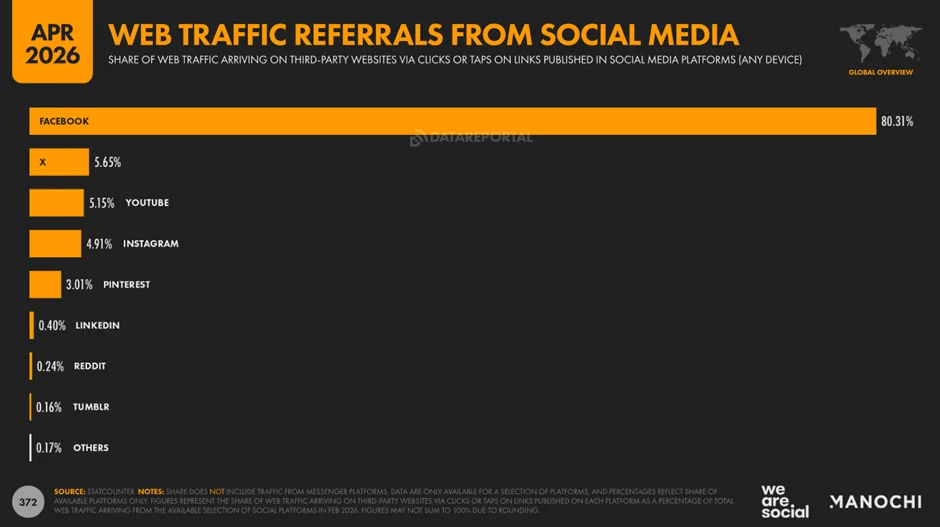
Facebook remains the main tool for redirecting audiences to websites, accounting for more than 80% of all referrals from social networks to third-party resources. All other platforms lag far behind: X accounts for only 5.65%, while YouTube and Instagram each generate about 5% of traffic. Pinterest rounds out the top five active referral sources with 3%.
AI usage
As of April 2026, the audience of AI tools such as ChatGPT and Gemini reached 2.42 billion active users, showing growth of 141% year over year. At the same time, the methodology accounts for China separately through CNNIC data, so DataReportal allows for the risk of user overlap and duplication.
If embedded AI in services such as Google and Office is included, reach rises to 4 billion users, or 81% of the internet audience. At the same time, developing countries in Asia and Africa are adopting the technology more actively than the United States and Europe. The huge gap between those who use background AI and users of chatbots guarantees further double-digit growth for the market.
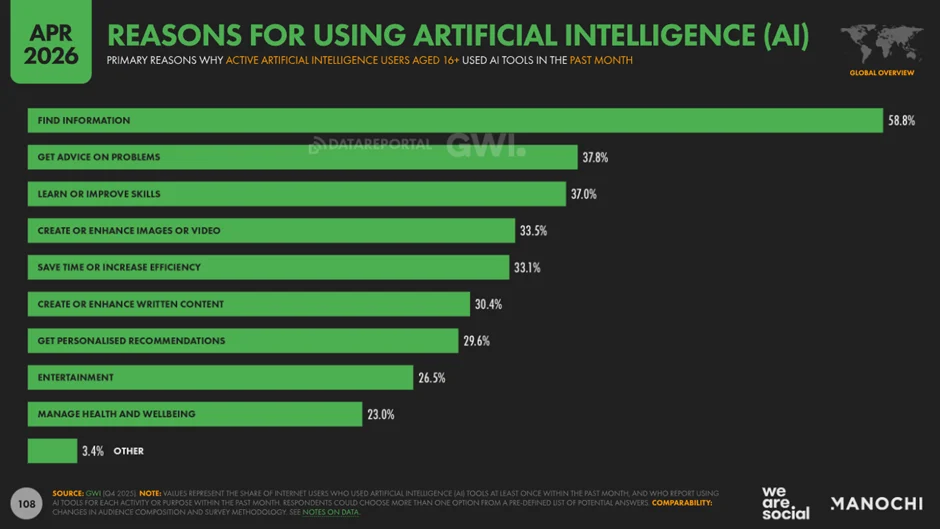
Main reasons for using artificial intelligence
As of April 2026, the main purpose for using AI tools remains finding information, cited by 58.8% of active users. AI is also in demand for solving problems and getting advice at 37.8%, learning in 37% of cases and creating visual content for 33.5% of respondents. About a third of users turn to these technologies to improve efficiency and work with texts.
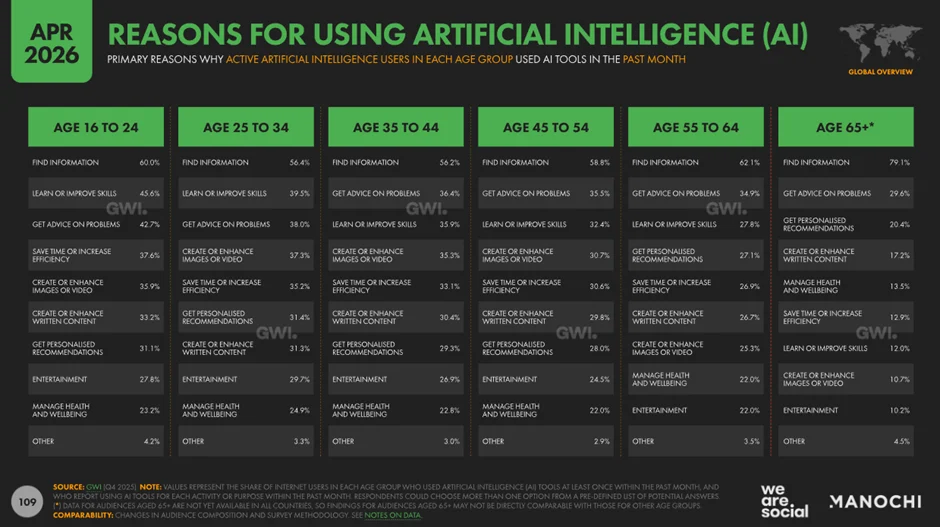
Reasons for using AI by age group
With age, the focus of AI usage shifts from creativity and productivity to purely informational queries. The strongest interest in finding information is seen in the 65+ group at 79.1%. Young people aged 16 to 24 use the technology more actively than others for learning and self-development, while middle-aged users more often turn to AI for creating visual content and improving efficiency. The 25-34 age group leads in using AI for entertainment.
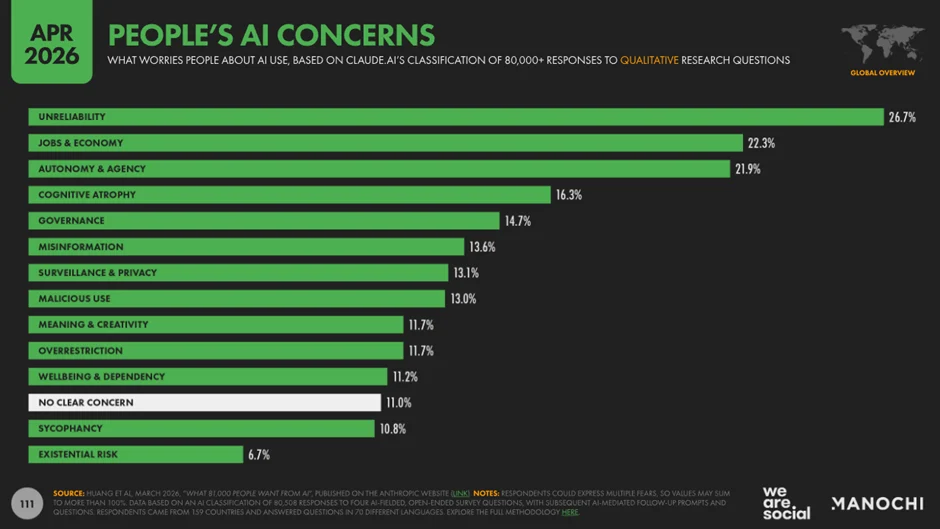
Main concerns people have about using AI
The main cause of user concern remains the unreliability of the technology, cited by 26.7% of respondents. Other significant concerns include AI’s impact on jobs and the economy at 22.3%, as well as loss of autonomy and control in 21.9% of cases. Cognitive degradation and issues of government regulation concern about 15-16% of respondents.
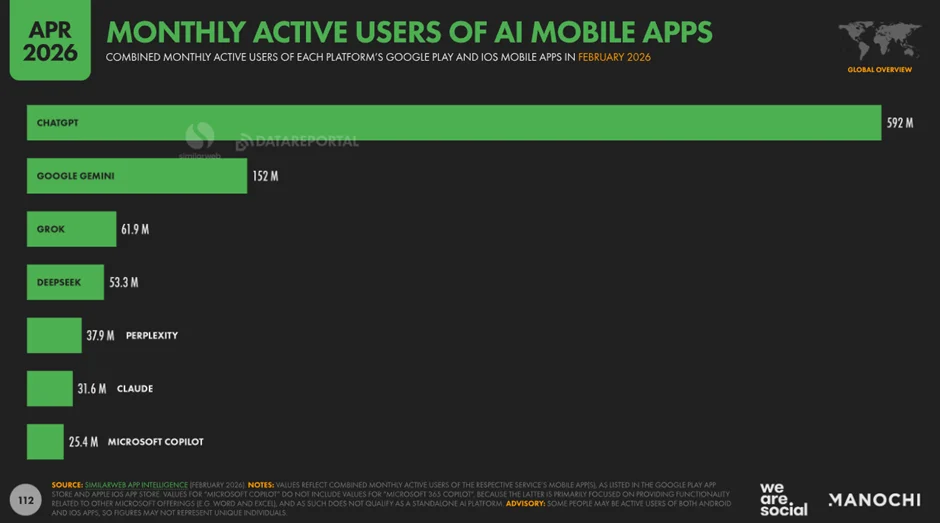
Monthly audience of AI mobile apps
As of February 2026, ChatGPT remains the market leader with an audience of 592 million monthly active users. Google Gemini ranks second with 152 million, significantly ahead of Grok and DeepSeek, whose audiences are 61.9 million and 53.3 million respectively. Perplexity, Claude and Microsoft Copilot round out the ranking.
The data reflects combined usage of apps from Google Play and iOS stores.
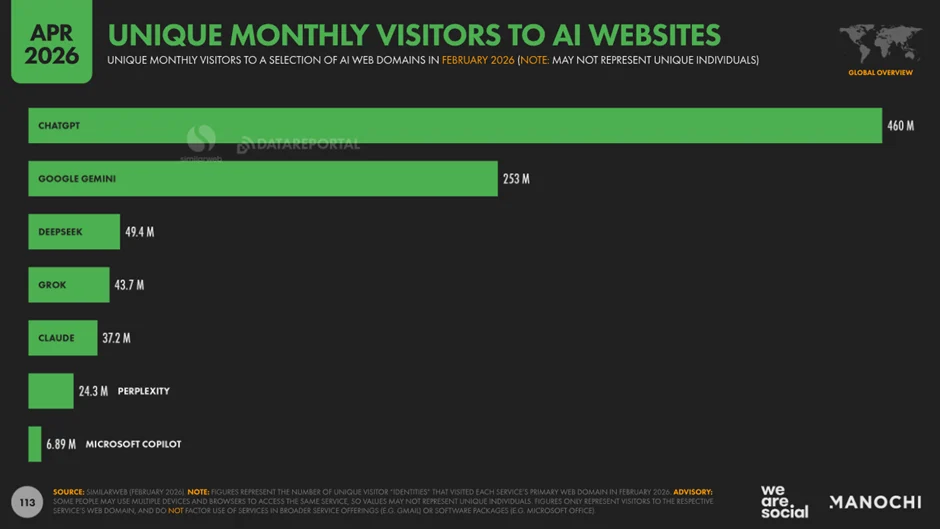
Unique monthly visitors to AI websites
ChatGPT leads the web segment with 460 million unique visitors. Google Gemini ranks second with 253 million visits. Other platforms, including DeepSeek, Grok and Claude, have significantly smaller reach, from 37 million to 49 million users. Microsoft Copilot rounds out the list with 6.89 million visitors to its web version.
These figures reflect visits only to the main domains.
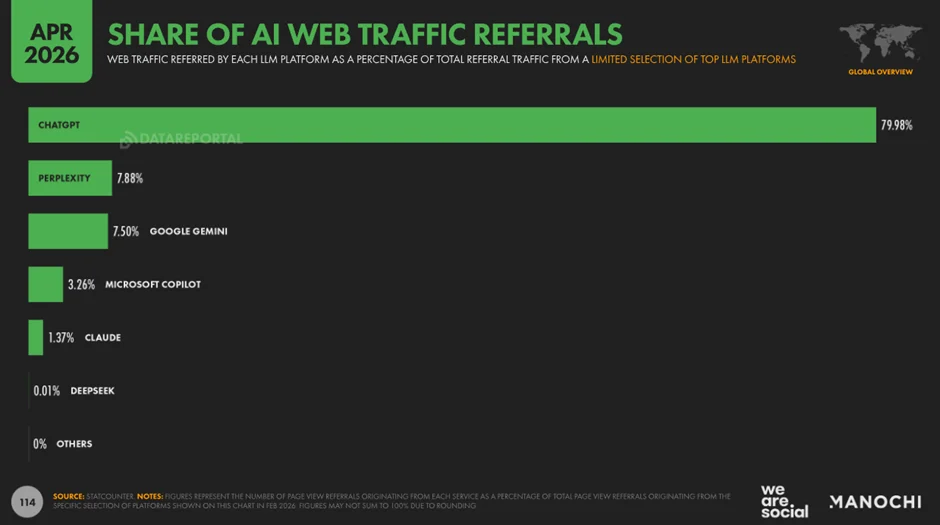
ChatGPT dominates as a source of referrals to third-party websites, generating almost 80% of all referral traffic among top LLM platforms. Perplexity and Google Gemini rank second and third with shares of about 7.9% and 7.5% respectively
Digital marketing
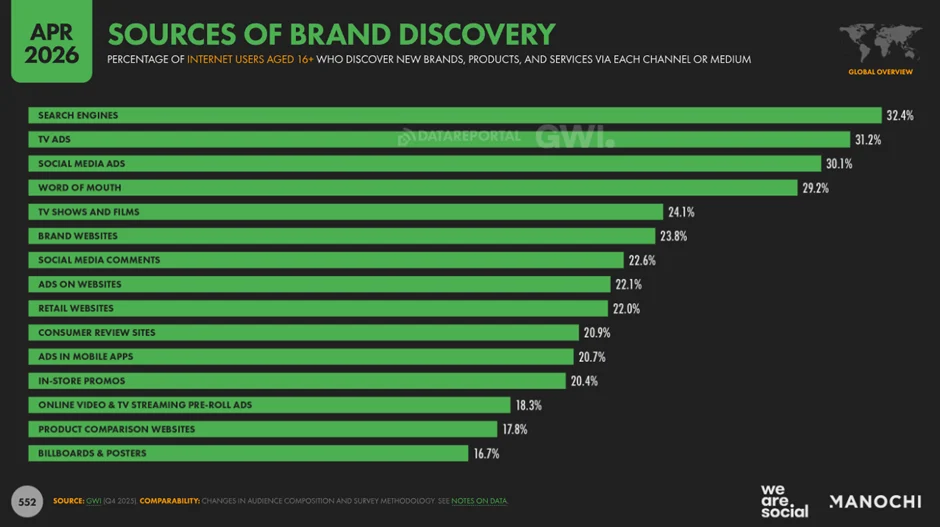
Search vs AI in the buyer journey
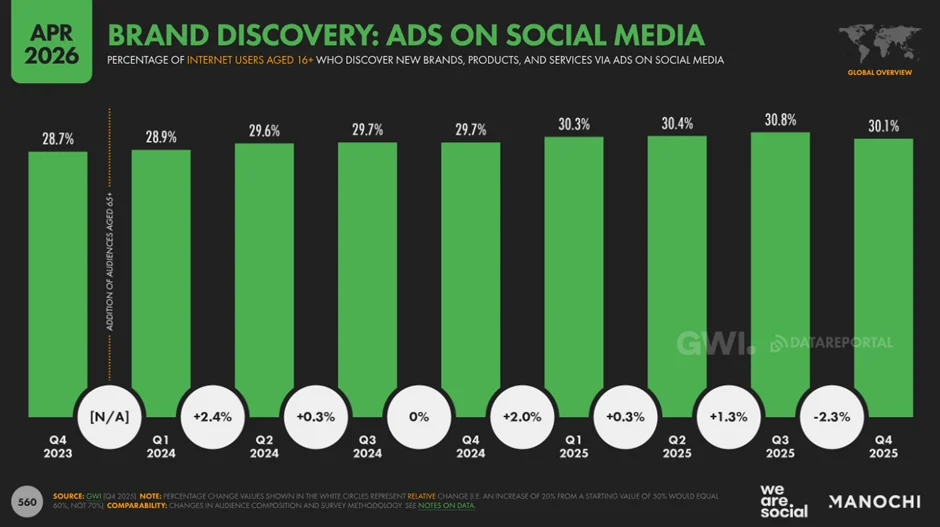
Search engines remain the leader in drawing attention to brands: 32.4% of users learn about new products through them. TV advertising ranks second at 31.2%, followed by social media at 30.1%.
Despite the media hype, AI tools are still not even among the top 15 sources: only 14.8% of people use them to search for brands. This is lower even than the reach of outdoor advertising, which stands at 16.7%.
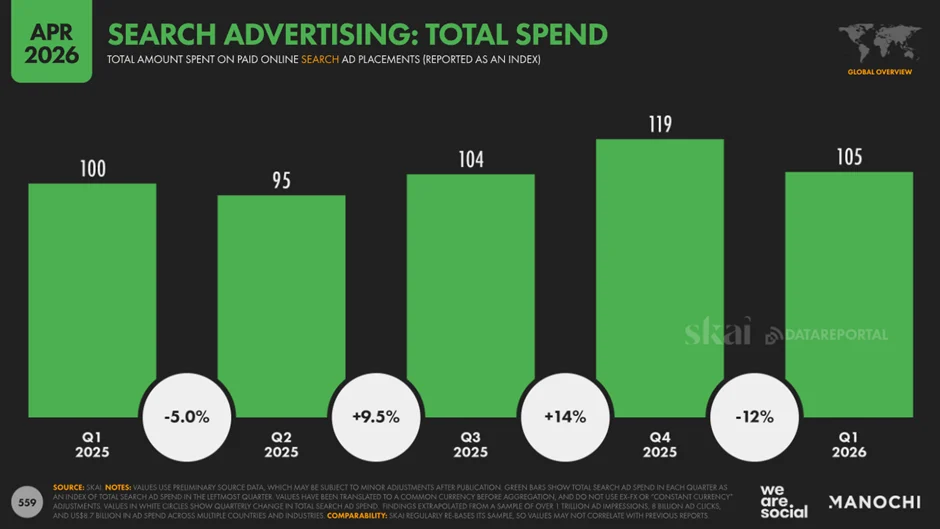
Search advertising
As of April 2026, the average cost per click in search engines reached $1.10, up 2.8% compared with the previous quarter. Since the beginning of 2025, there has been steady growth: over this period, cost per click increased by more than 10%. This statistic indicates continued strong competition in search advertising auctions and a gradual rise in traffic costs for advertisers.
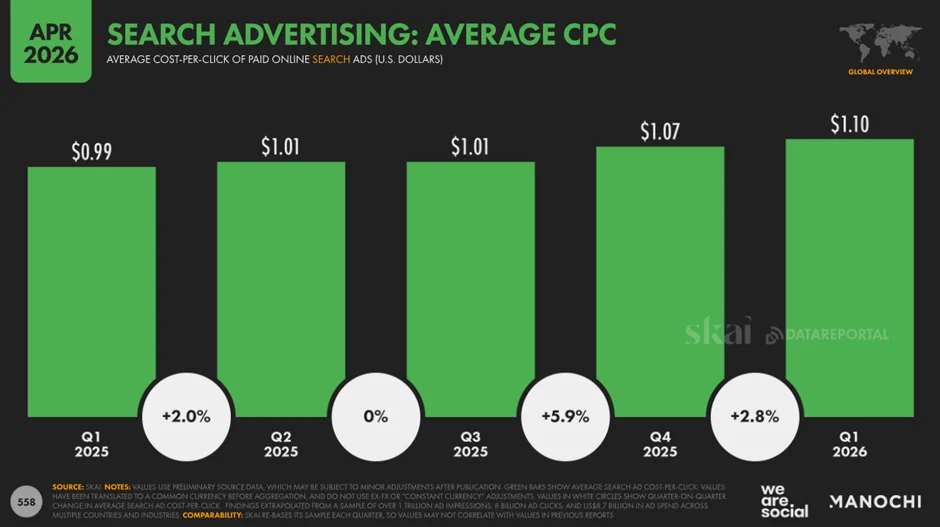
The overall search advertising spend index reached 105 points, which is 5% above the level at the start of last year.
Social media
The share of users who learn about new brands through social media was 30.1%.
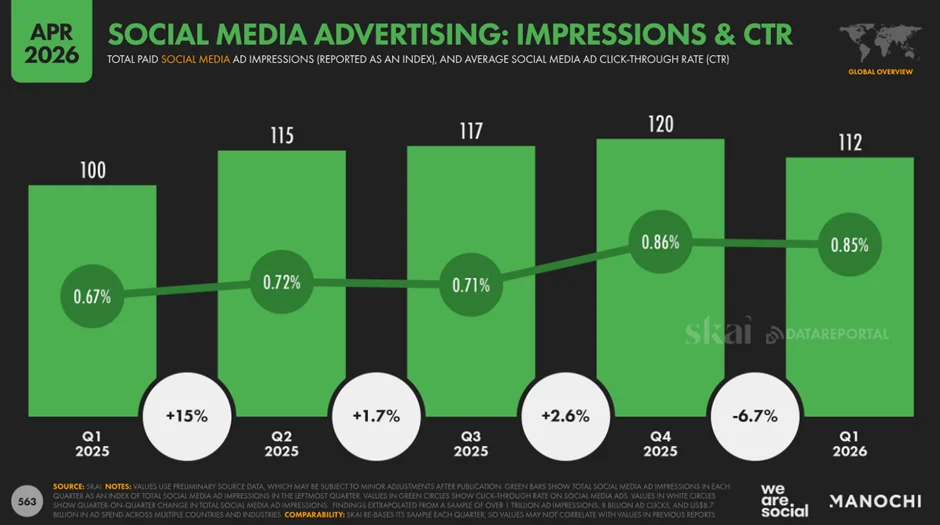
The number of paid ad impressions increased by 12% year over year, while the average click-through rate (CTR) settled at 0.85%. Since the beginning of 2025, there has been a general trend toward higher engagement: CTR increased from 0.67%.
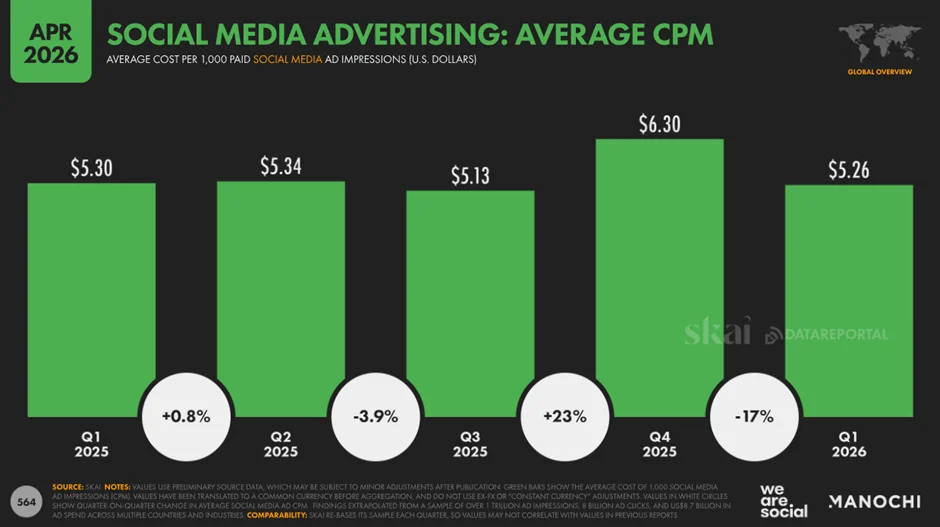
The average CPM is $5.26, which is almost in line with the level at the start of last year. The chart clearly shows seasonal volatility: in the fourth quarter of 2025, the cost jumped sharply by 23%, reaching a peak of $6.30 amid pre-holiday activity.
Full report
Presentation with the full report “Digital 2026 Mid-Year Global Update Report”: