



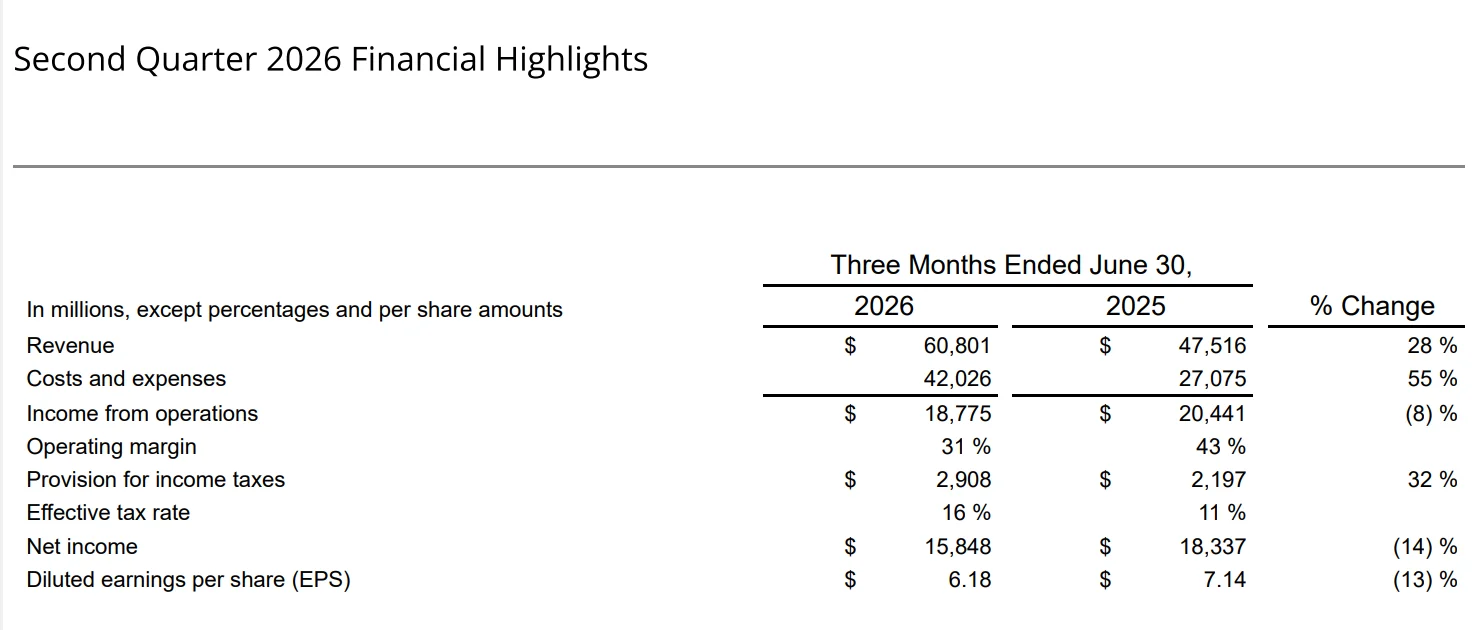
According to a financial report published by Meta Platforms, Inc. on July 29, 2026, the company’s revenue reached $60.8 billion in the second quarter. Advertising revenue grew 27% year over year to $59.36 billion. The number of ad impressions increased by 14%, while the average price per ad rose by 12%. At the same time, Meta’s net income fell 14% year over year to $15.85 billion. The financial results were affected by major one-time legal expenses and increased investment in AI infrastructure.
Key metrics for Q2 2026
- Daily active people (DAP). In June 2026, the average was 3.60 billion people (+3% year over year).
- Ad impressions. Up 14% compared to the same period last year.
- Average price per ad. Increased by 12% year over year.
- Revenue. Reached $60.80 billion (+28% year over year).
- Advertising revenue. Reached $59.36 billion, or 97.6% of total revenue (+27% year over year).
- Net income. Reached $15.85 billion (-14% year over year).
- Expenses. Total expenses grew by 55% to $42.03 billion, including:
- $2.40 billion in legal proceedings expenses;
- $1.18 billion in severance payments related to the May 2026 workforce reduction.
- Free cash flow (FCF). Fell to $784 million from $8.55 billion in Q2 2025, primarily due to increased capital expenditures on equipment and data center construction.
- Headcount. As of June 30, 2026, the company’s headcount stood at 75,472 employees (-1% year over year), including about 8,000 employees laid off in May who are set to leave the company by the end of Q3.
Comparison of Q1 and Q2 2026 metrics
| Metric | Q1 2026 | Q2 2026 | Change (vs. Q1 2026) |
| Revenue | $56.31 billion | $60.80 billion | +8.0% (+$4.49 billion) |
| Advertising revenue | $55.02 billion | $59.36 billion | +7.9% (+$4.34 billion) |
| Net income | $26.77 billion* | $15.85 billion | -40.8% (-$10.92 billion) |
| Total expenses | $33.44 billion | $42.03 billion | +25.7% (+$8.59 billion) |
| Capital expenditures (CapEx) | ~$19.00 billion | $31.08 billion | +63.6% (+$12.08 billion) |
| Free cash flow (FCF) | $12.39 billion | $0.78 billion | -93.7% (-$11.61 billion) |
| Active audience (DAP) | 3.56 billion | 3.60 billion | +1.1% (+40 million) |
| Headcount | 77,986 | 75,472 | -3.2% (-2,514) |
*Note on Q1: The high net income in Q1 was driven by a one-time tax benefit of $8.03 billion.
- The full report is available on Meta’s investor relations portal: https://investor.atmeta.com/investor-news/press-release-details/2026/Meta-Reports-Second-Quarter-2026-Results/default.aspx








Comments