



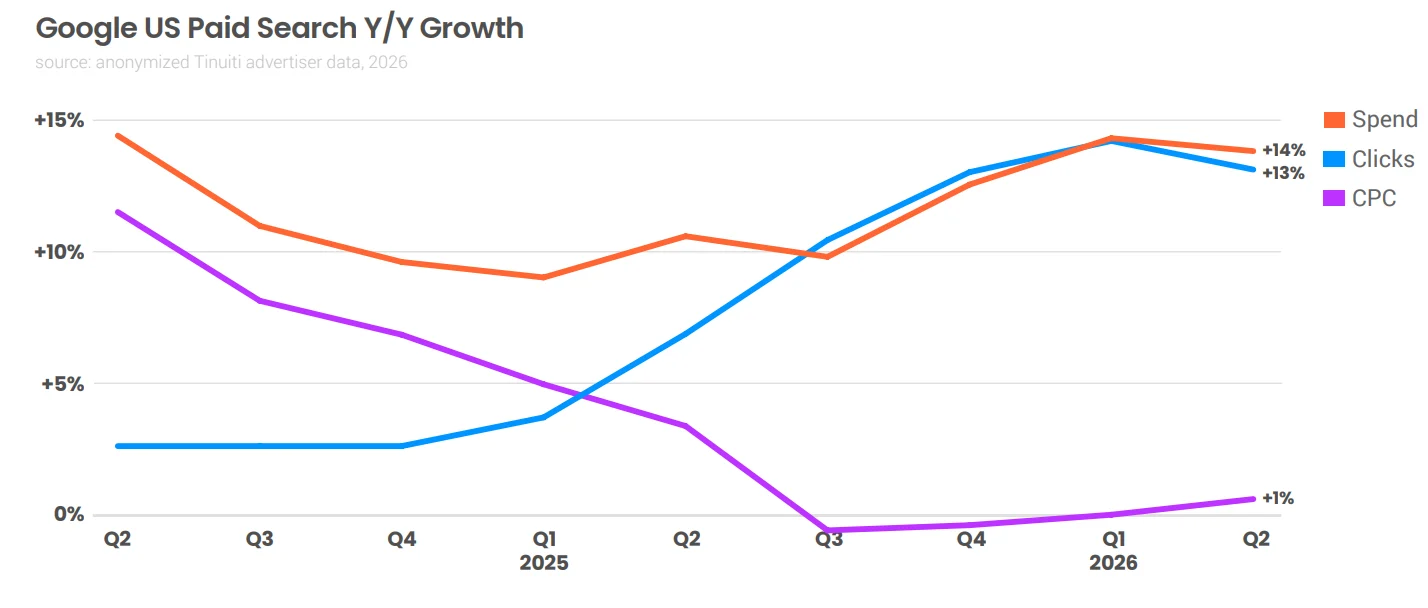
In the second quarter of 2026, spending on Google advertising continued to grow. Search ad spend increased 14% year over year, with Google Shopping remaining the main driver of growth. At the same time, advertisers began cutting back on Performance Max’s share and redistributing budgets across formats.
This article is based on the Tinuiti Digital Ads Benchmark report for the second quarter of 2026, compiled from advertising campaign data with a combined annual budget of more than $4 billion. Figures are presented on a year-over-year basis (compared to the same period last year), rather than compared to the first quarter, unless otherwise noted.
Comparative Growth Statistics: Q1 vs. Q2 2026
| Metric (year-over-year growth) | Q1 2026 | Q2 2026 |
| Search advertising (spend) | +14% | +14% |
| Search advertising (clicks) | +14% | +13% |
| Search advertising (CPC) | 0% | +1% |
| Shopping (spend) | +18% | +18% |
| Shopping (clicks) | +18% | +19% |
| PMax share of Shopping budgets | 67% | 60% |
Search Advertising
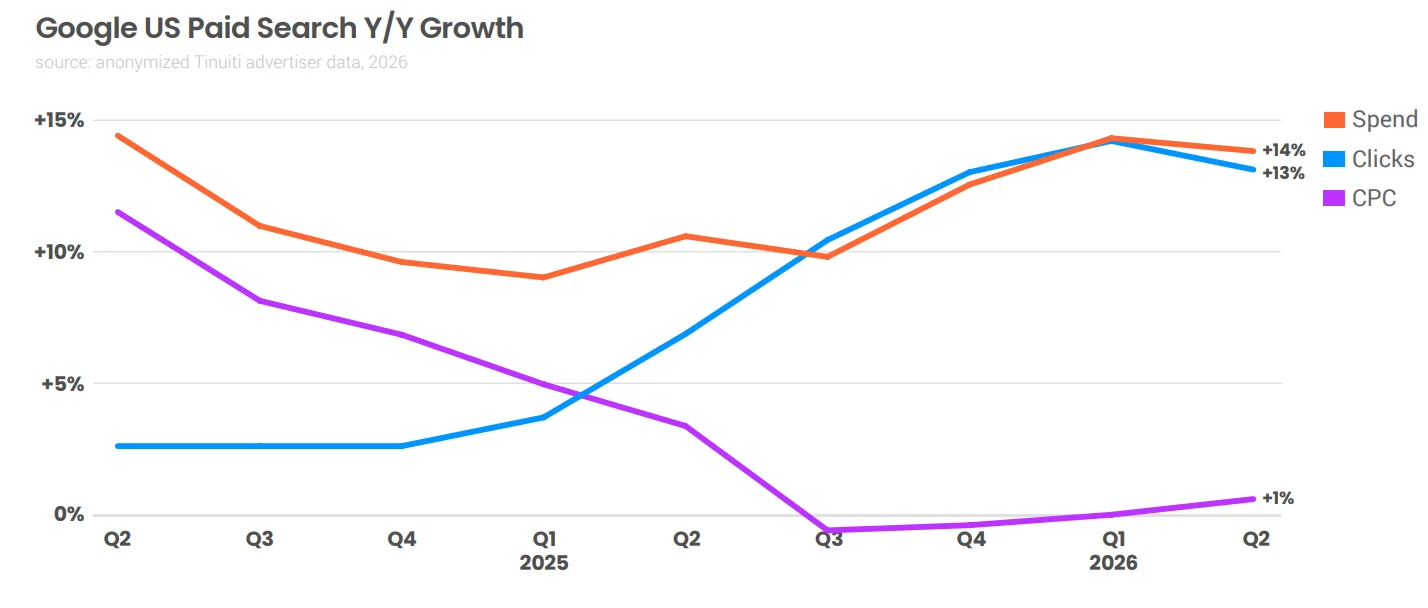
- In Q2 2026, spending on Google paid search grew 14%.
- Click growth came in at 13%, slightly down from the five-year high recorded in the first quarter.
- Average cost per click (CPC) showed minimal growth of 1%.
An important factor holding down prices and supporting click growth for most advertisers remains the fact that Amazon exited Google’s product listings in the third quarter of 2025 and still isn’t participating in most auctions.
Google Shopping Campaigns
Google Shopping is advertising for products with photos, prices, and links to the store directly in Google search.
- Spending on product ads grew 18%, matching the first quarter’s trend.
- Click volume accelerated to +19%, while average cost per click (CPC) declined 1%.
Performance Max (PMax)
Performance Max (PMax) is an automated Google ad format that shows ads across all Google properties to drive more sales or leads.
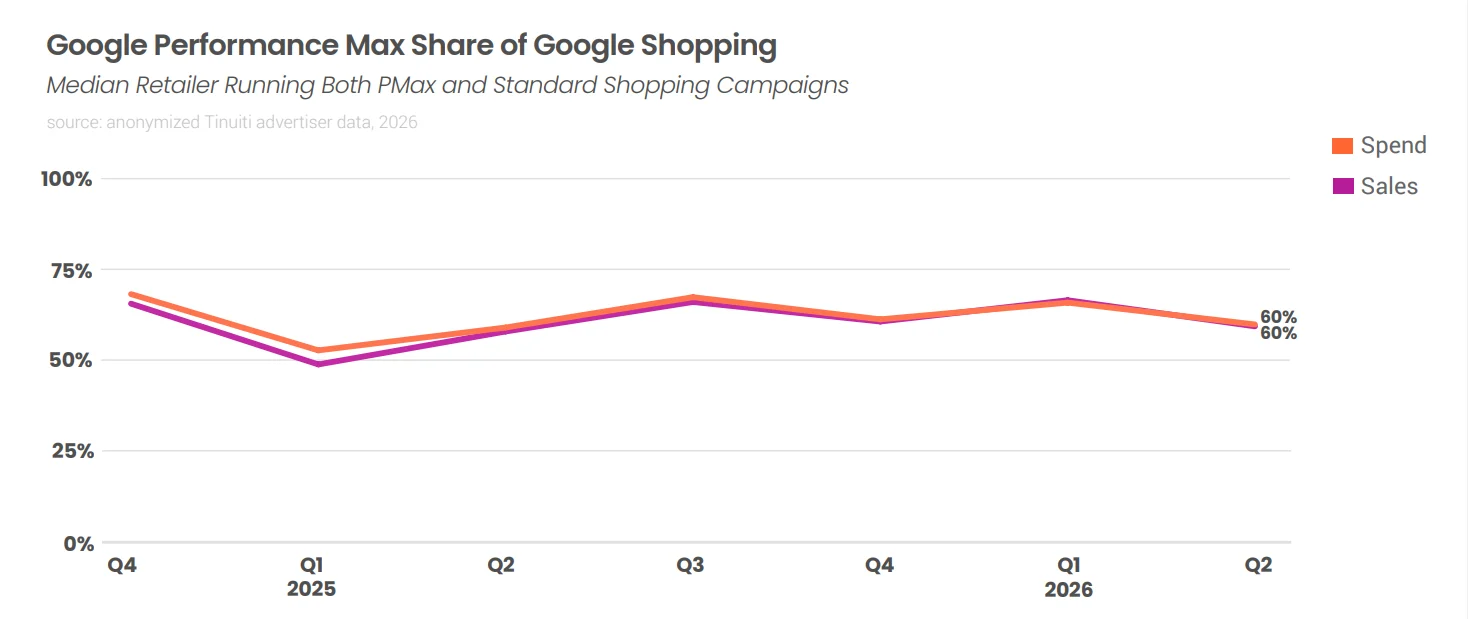
After peaking in the first quarter, advertisers slightly redistributed budgets in the second quarter of 2026:
- PMax accounted for 60% of all Google product advertising spend.
- PMax’s share of sales was also 60%.
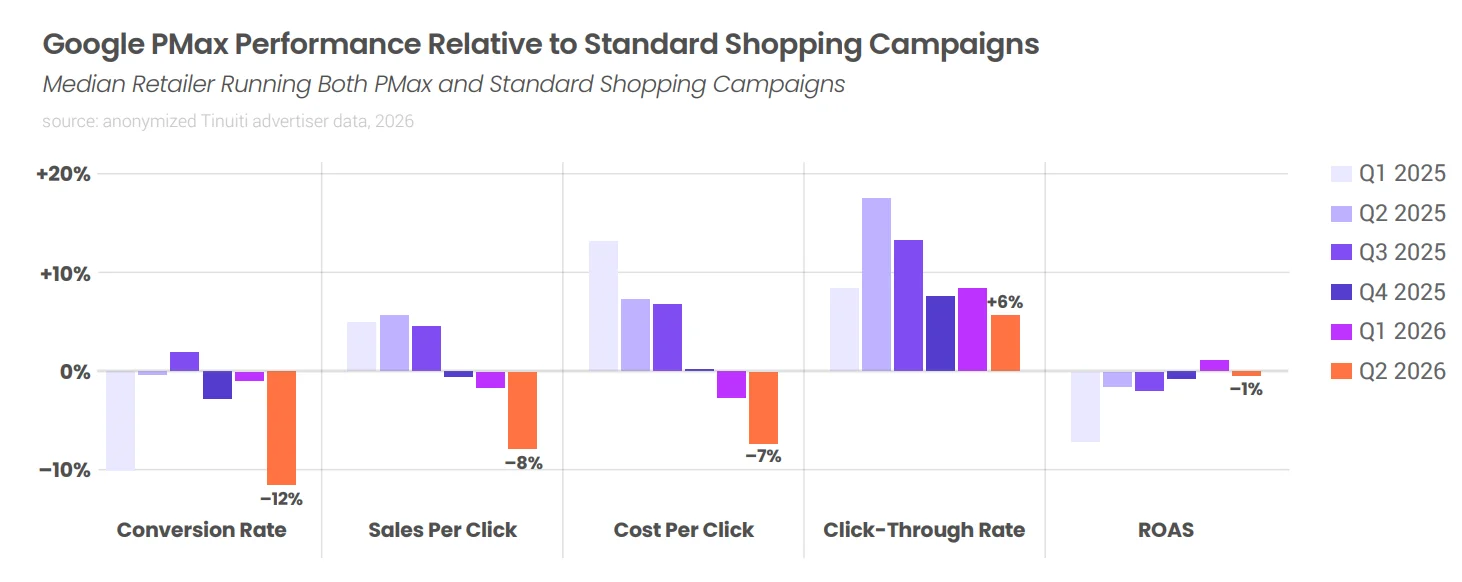
- PMax’s share of budgets declined due to falling sales-per-click efficiency and lower CPC compared to standard Google Shopping
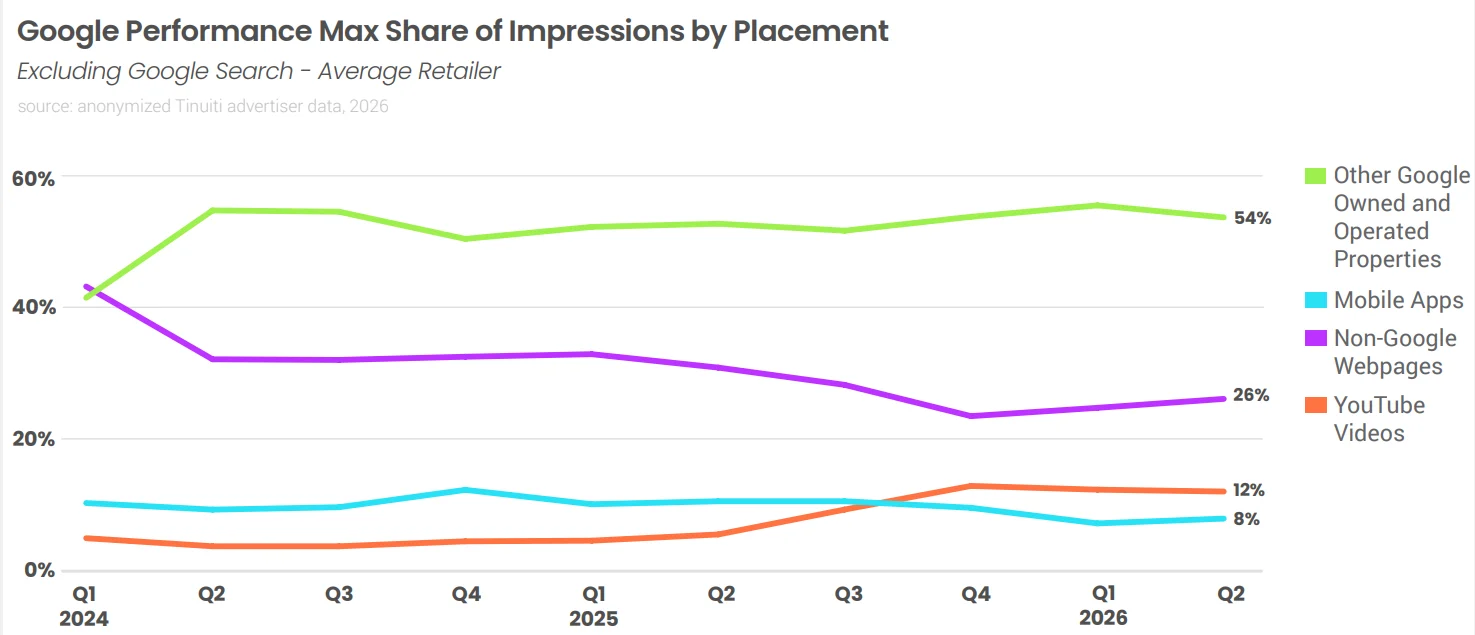
Among PMax impressions outside of classic search, Google’s own properties account for the largest share — 54%. Third-party sites account for 26% of impressions, YouTube video for 12%, and mobile apps for 8%.
Text Ads
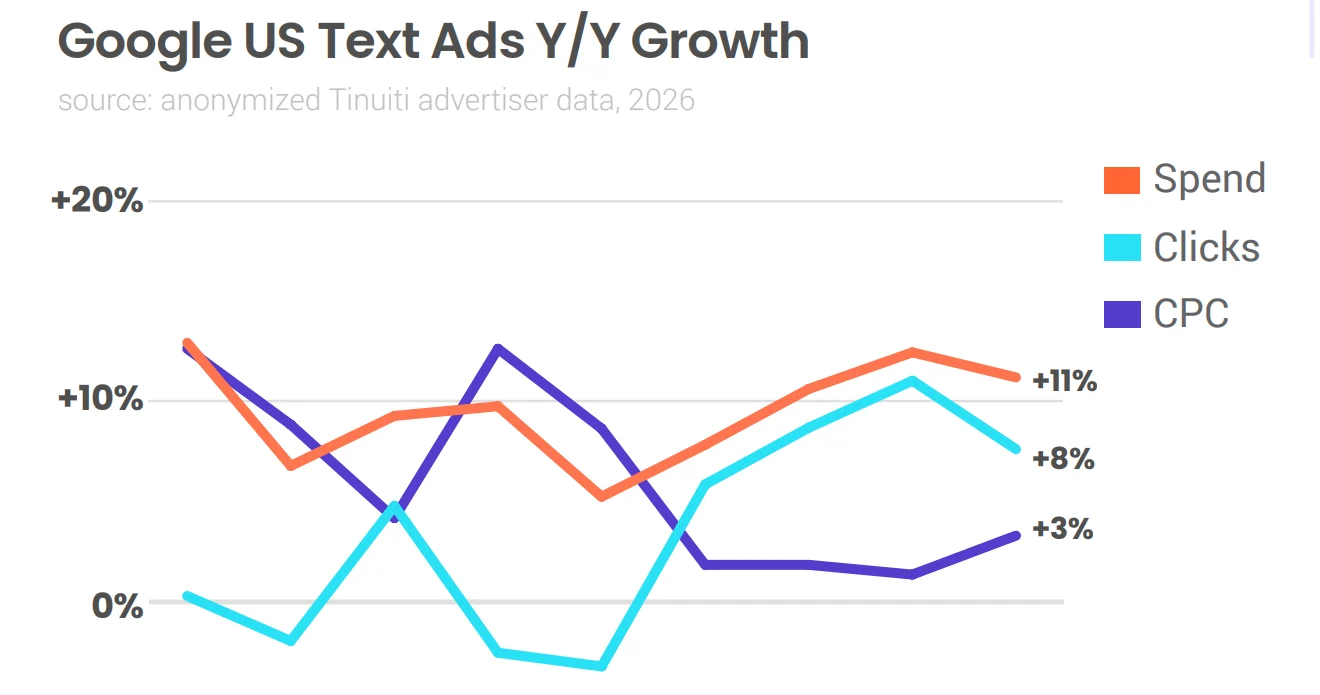
The text ads segment maintained solid growth in the second quarter: spending rose 11%, click volume grew 8%, and cost per click (CPC) rose 3%.
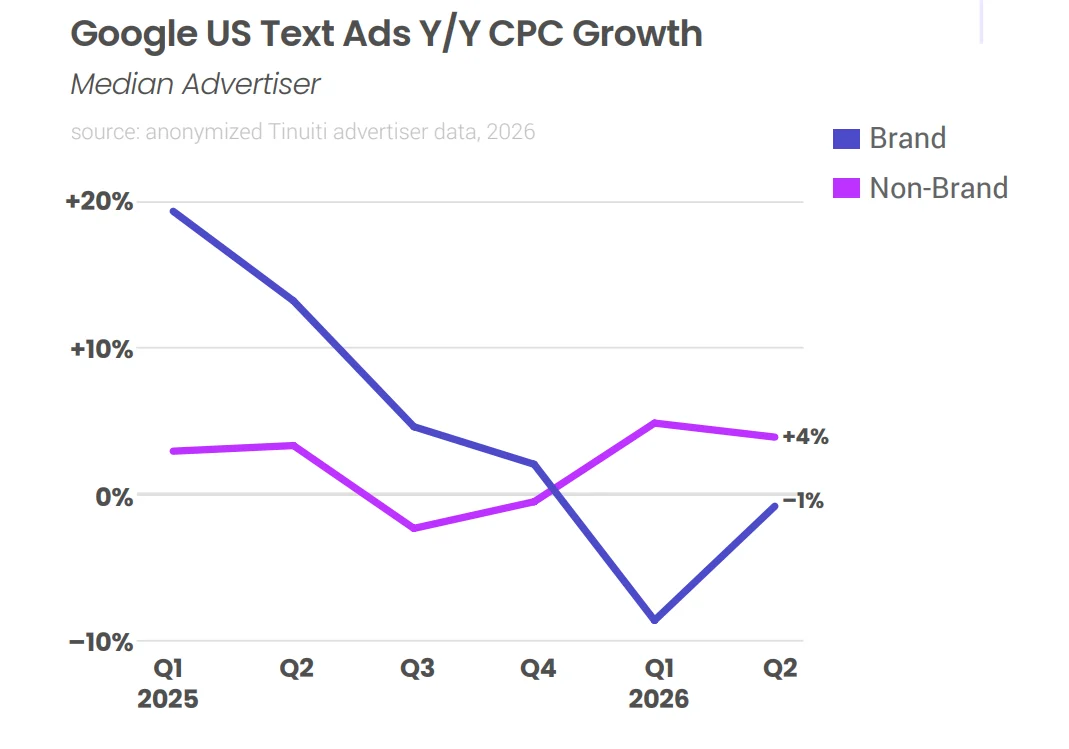
- Branded traffic: After a sharp drop in the cost of branded queries in the first quarter, the decline in CPC slowed significantly in Q2, coming in at just 1%.
- Non-branded search: The cost of non-branded clicks rose 4%, largely maintaining the trend from earlier in the year.
YouTube
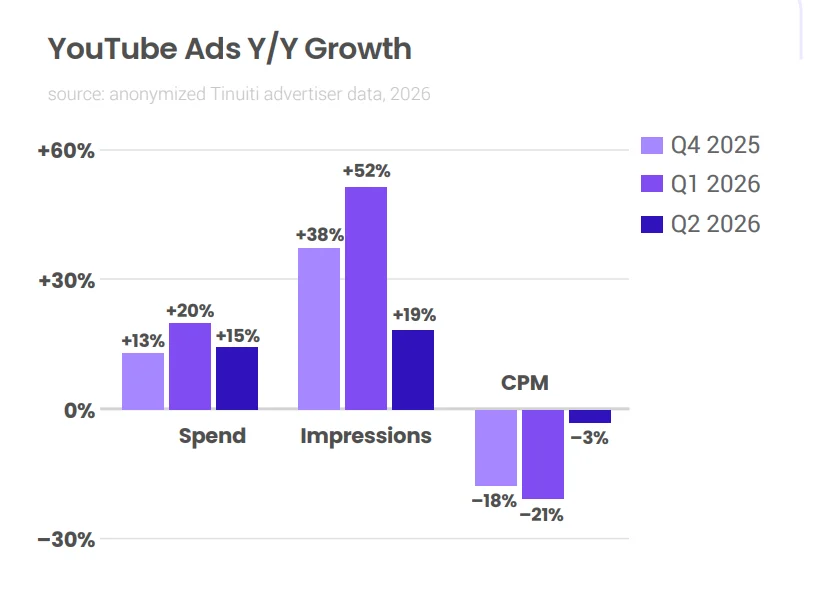
- In Q2 2026, YouTube ad spend grew 15%, slightly trailing the first quarter’s pace due to stronger comparables from the same period last year.
- Impression volume increased 19%.
- Rapid auction recovery: a 3% drop in CPM in the second quarter marks a significant improvement following a 21% price collapse earlier in the year.
The primary devices for watching YouTube remain smartphones at 44% and TVs at 42%. However, in classic video advertising, TVs lead by far, accounting for 75% of ad spend, while smartphones account for only 12%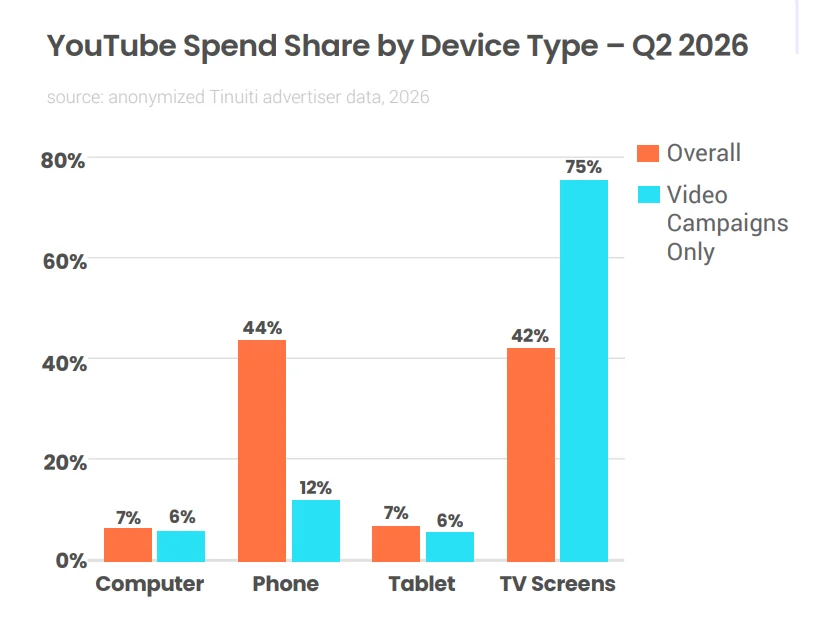
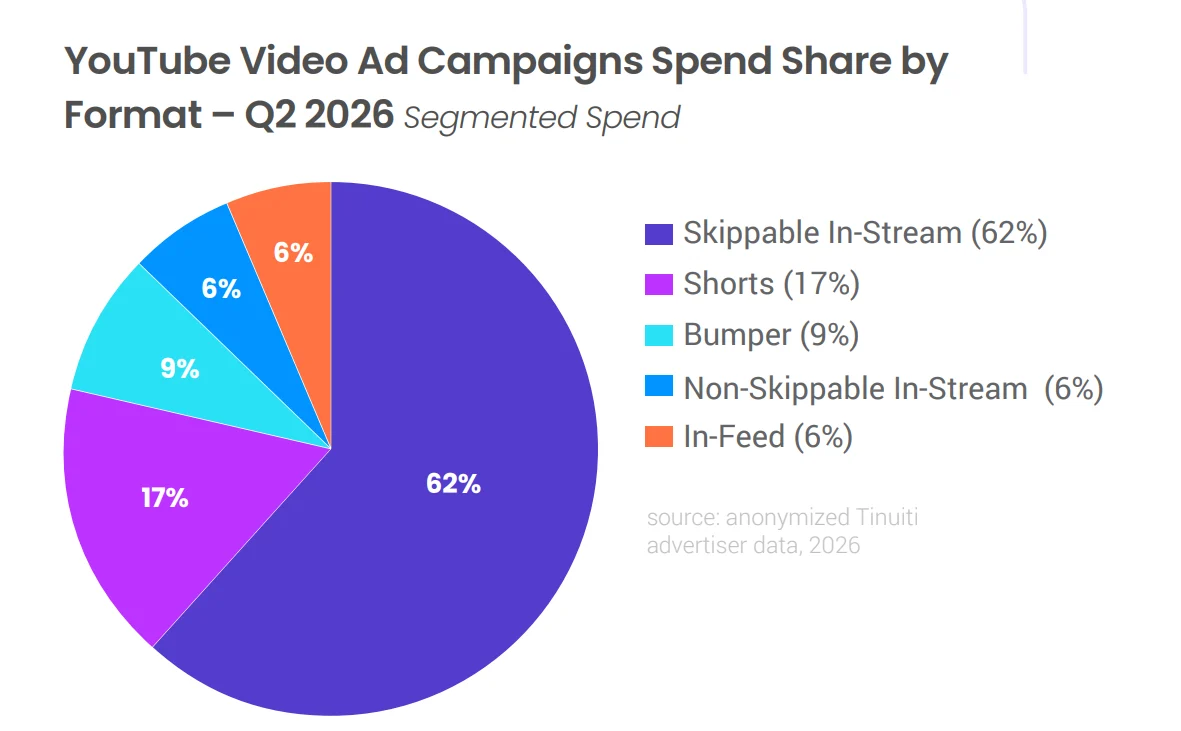
In Q2 2026, YouTube Shorts accounted for 17% of all YouTube video ad spend. Notably, most Shorts ads are viewed on TVs rather than smartphones.
Demand Gen
Demand Gen is an ad format that helps attract new customers and generate interest in a product.
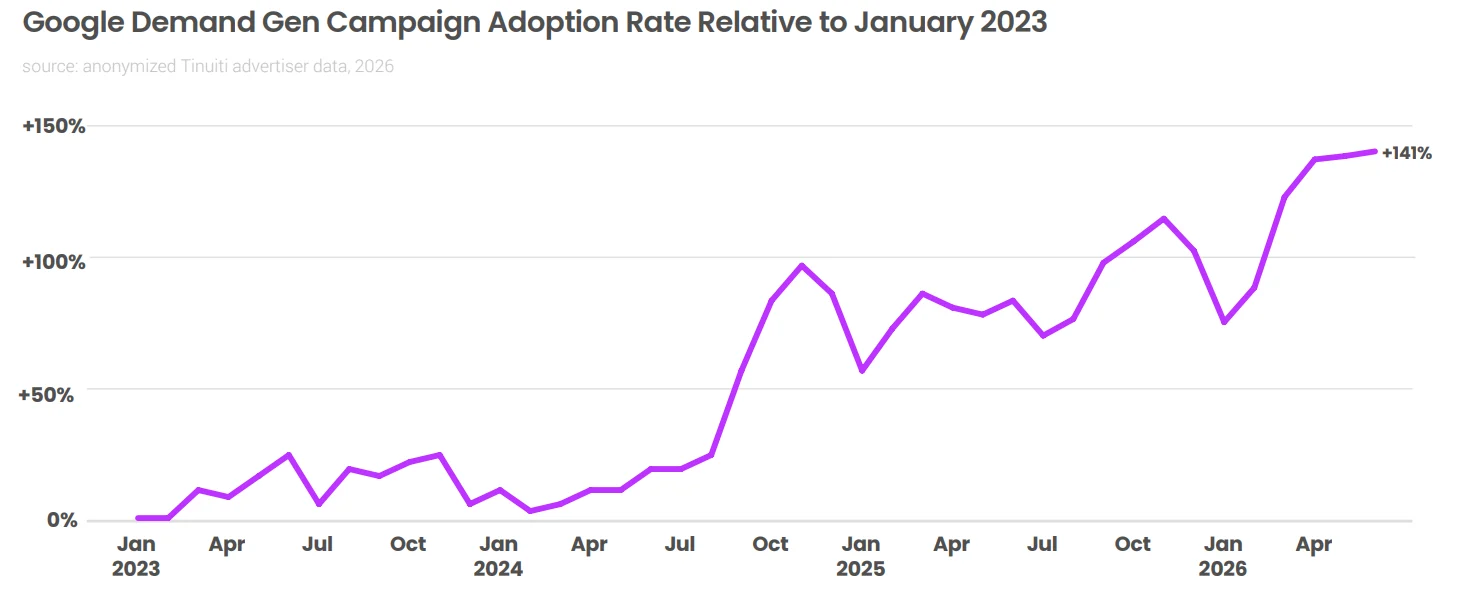
Demand Gen adoption has reached a high point. Compared to early 2023, adoption has grown 141%. Additional growth is tied to Google’s ongoing migration of standard Display Campaigns into Demand Gen.
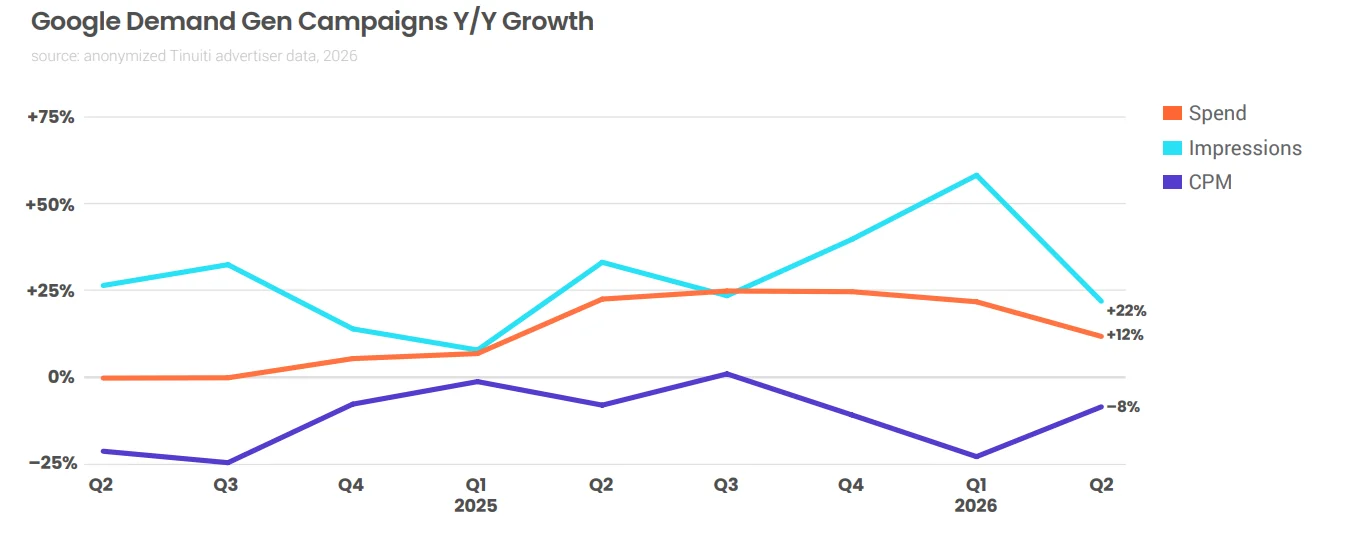
In the second quarter, spending grew 12%, impressions rose 22%, and CPM fell 8%. Growth rates are slowing, but the format continues to expand. Within Demand Gen, 60% of budget goes to video, with the remaining 40% split between images and other formats
Google Display Network
Google Display Network (GDN) is Google’s ad network that shows banners on websites and in mobile apps.
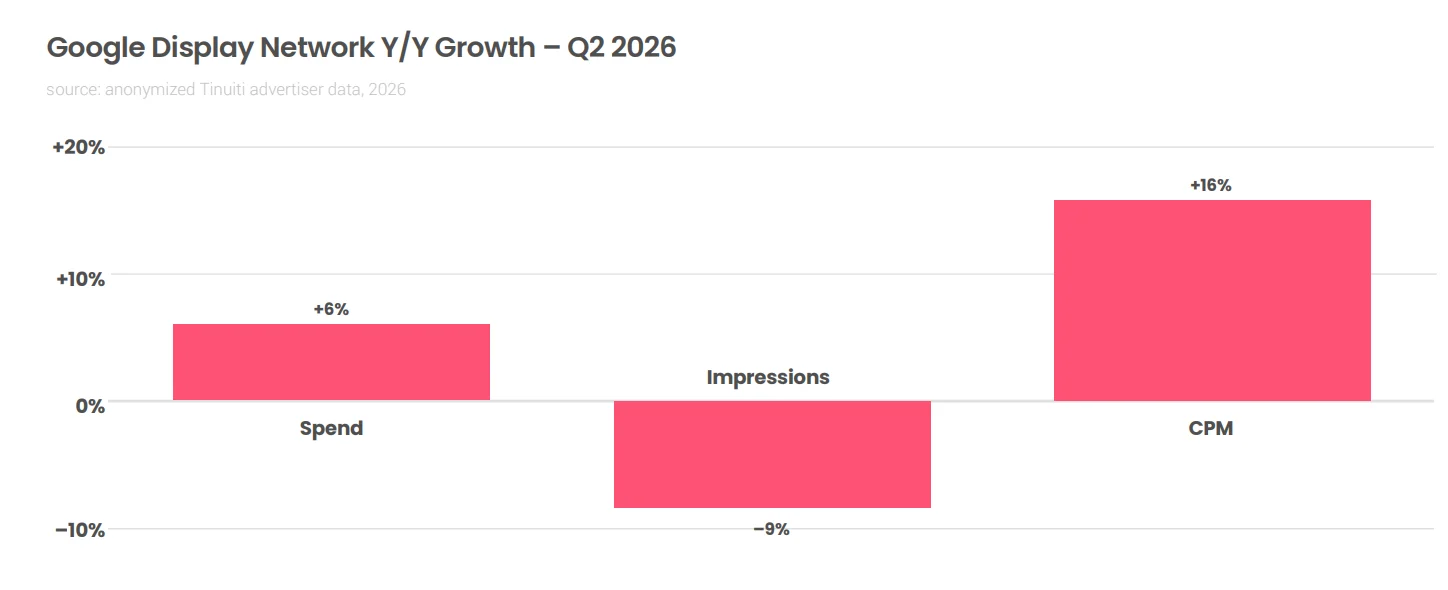
In the second quarter, GDN ad spend grew 6%, while cost per thousand impressions (CPM) rose 16%. At the same time, impression volume fell 9%, indicating that ad placements have become more expensive despite the decline in impression volume.
- More details in the report Tinuiti Digital Ads Benchmark.