



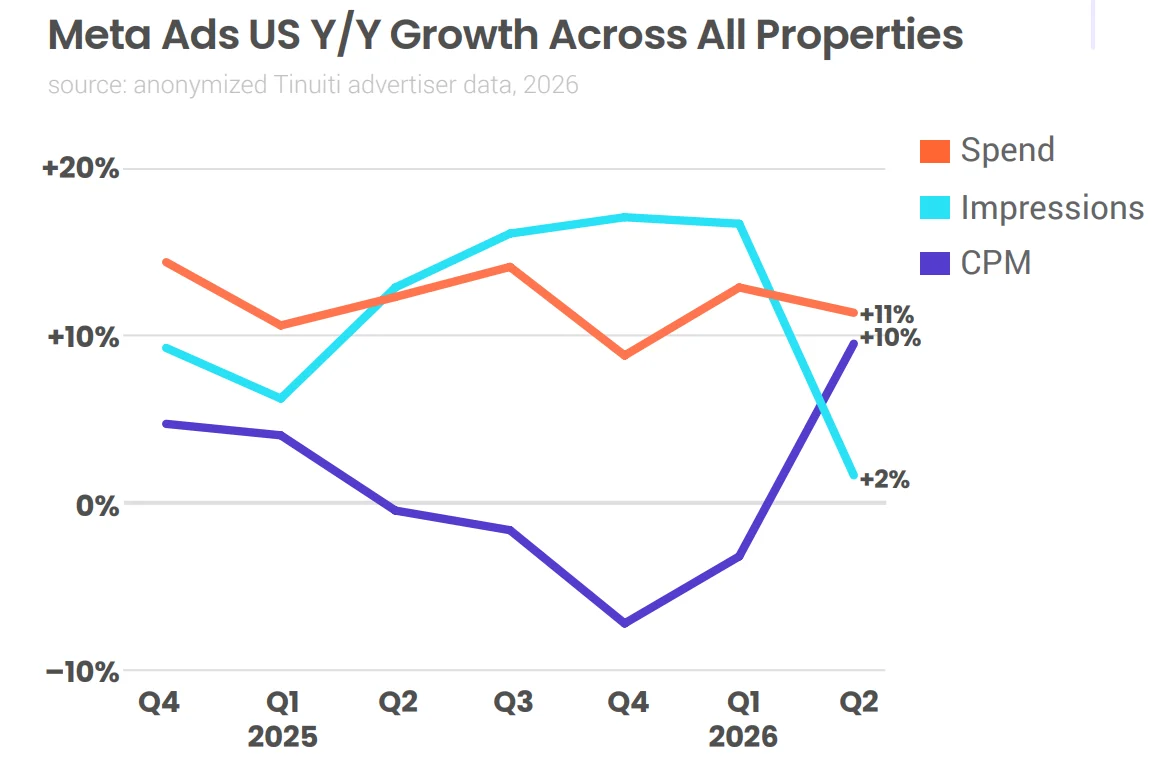
In the second quarter of 2026, ad spend on Meta grew 11% year over year, while the number of impressions increased by only 2%. As spend growth outpaced impression growth, the average CPM rose 10%. This is the highest year-over-year growth rate for the metric since the first quarter of 2022.
This article is based on the report Tinuiti Digital Ads Benchmark for the second quarter of 2026, compiled from anonymized US ad campaign data with total annual spend exceeding $4 billion. All changes are year-over-year unless otherwise noted. Comparing Q1 and Q2 shows the change in annual growth rates, not sequential quarter-over-quarter dynamics.
Trends in Meta Metrics in Q1 and Q2 2026
In the first quarter, growth in Meta ad spend was accompanied by faster growth in impressions. In the second quarter, the ratio shifted: spend continued to grow at double-digit rates, but impression growth nearly stalled.
| Metric | Q1 2026, YoY | Q2 2026, YoY | Change in trend |
| Meta ad spend | +13% | +11% | Slowdown of 2 pp |
| Meta impressions | +17% | +2% | Slowdown of 15 pp |
| Average Meta CPM | −3% | +10% | Acceleration of 13 pp |
| Facebook CPM | −4% | +13% | Acceleration of 17 pp |
| Instagram CPM | −3% | 0% | Acceleration of 3 pp |
The main shift in the second quarter isn’t a cut in ad spend, but a sharp slowdown in the growth of available impression volume. The gap between spend and impression growth is what drove CPM.
Change in the Ratio of Spend, Impressions, and CPM
In the first quarter of 2026, Meta ad spend rose 13% compared to the same period a year earlier. Impressions increased 17% during that time. Since impression volume grew faster than spend, average CPM fell 3%. In other words, advertisers were getting more impressions without a proportional increase in placement costs.
In the second quarter, the situation changed:
- ad spend grew 11% year over year;
- impressions increased by only 2%;
- average CPM rose 10%.
The 10% CPM increase is the highest year-over-year growth rate for this metric across the Meta ecosystem since the first quarter of 2022.
Facebook and Instagram Performance
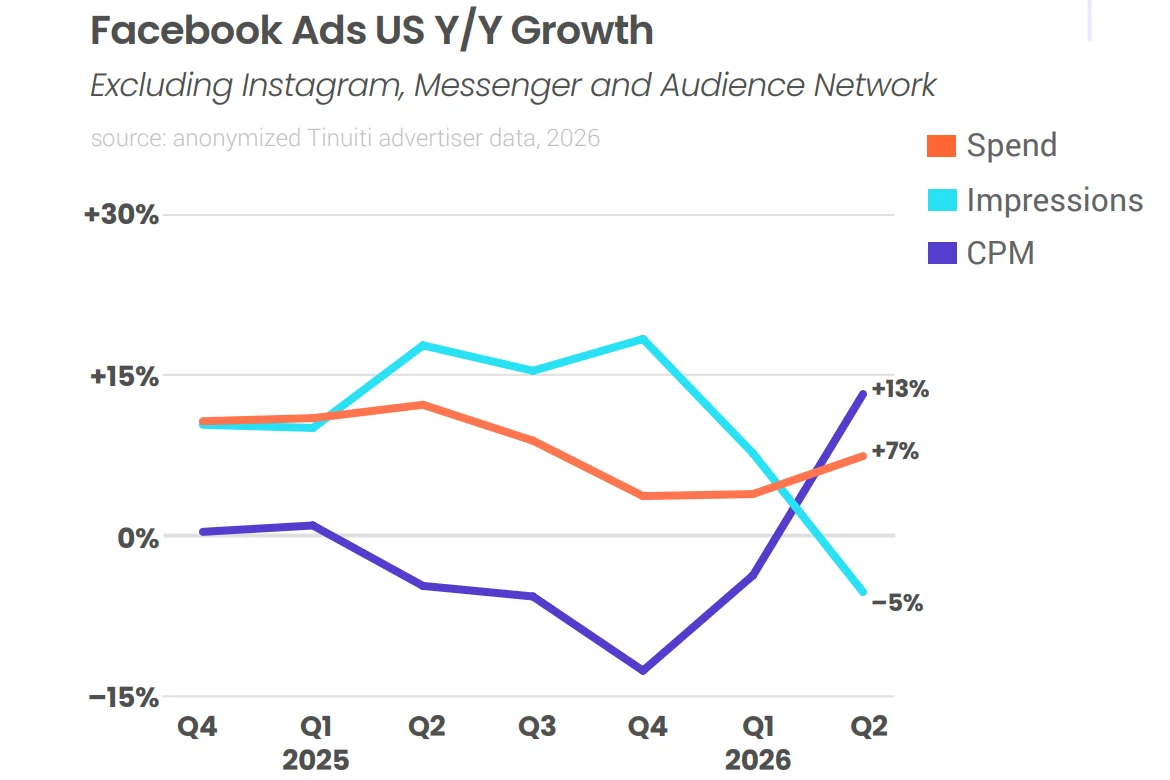
- Facebook ad spend rose 7% year over year in the second quarter. That’s higher than the first quarter’s 4% growth.
- At the same time, impressions on the platform fell 5% compared to the second quarter of 2025.
- The combination of rising spend and declining impressions was accompanied by a 13% year-over-year increase in CPM. This is the highest year-over-year growth rate for cost per thousand impressions on Facebook since the first quarter of 2022.
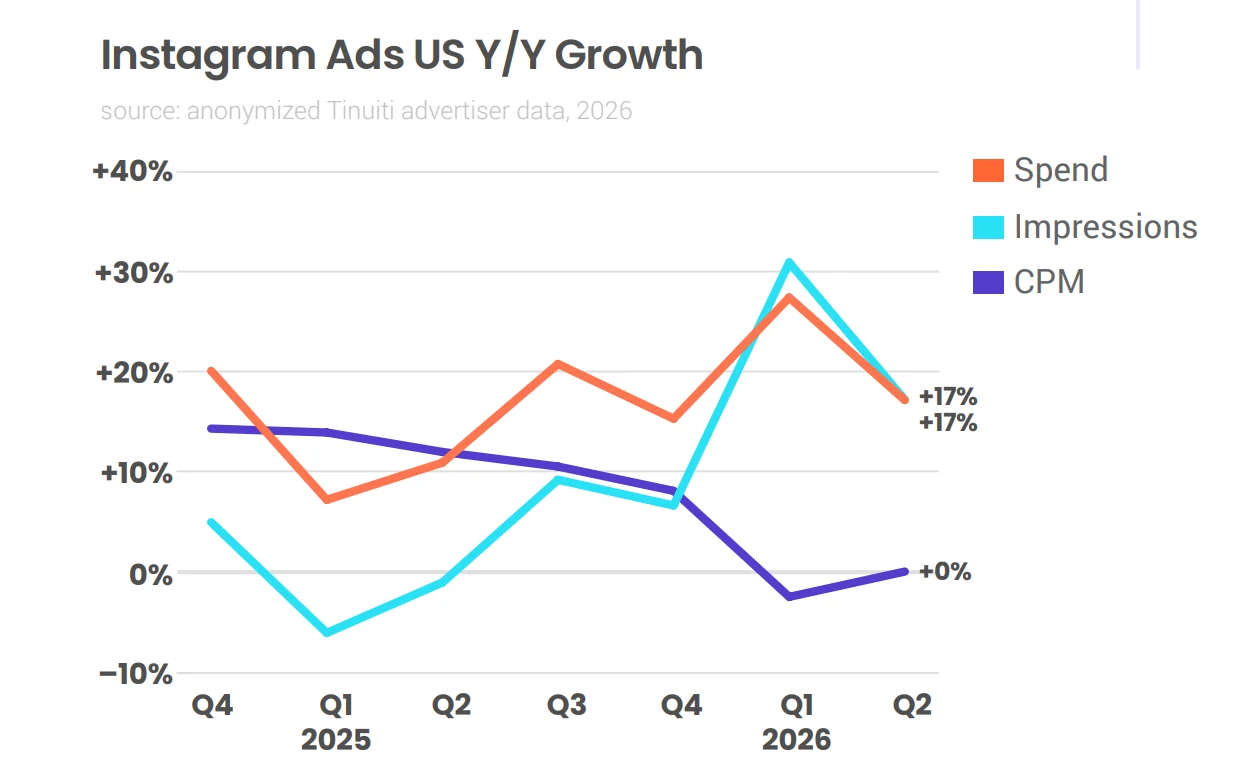
- Ad budgets on the platform grew 17% year over year;
- Impression volume also increased by 17%;
- Average CPM on Instagram was unchanged compared to the second quarter of last year, 0% change.
Since spend and impressions grew at the same rate, the additional demand hasn’t yet led to a significant increase in average cost per thousand impressions.
Distribution of Impressions by Ad Format
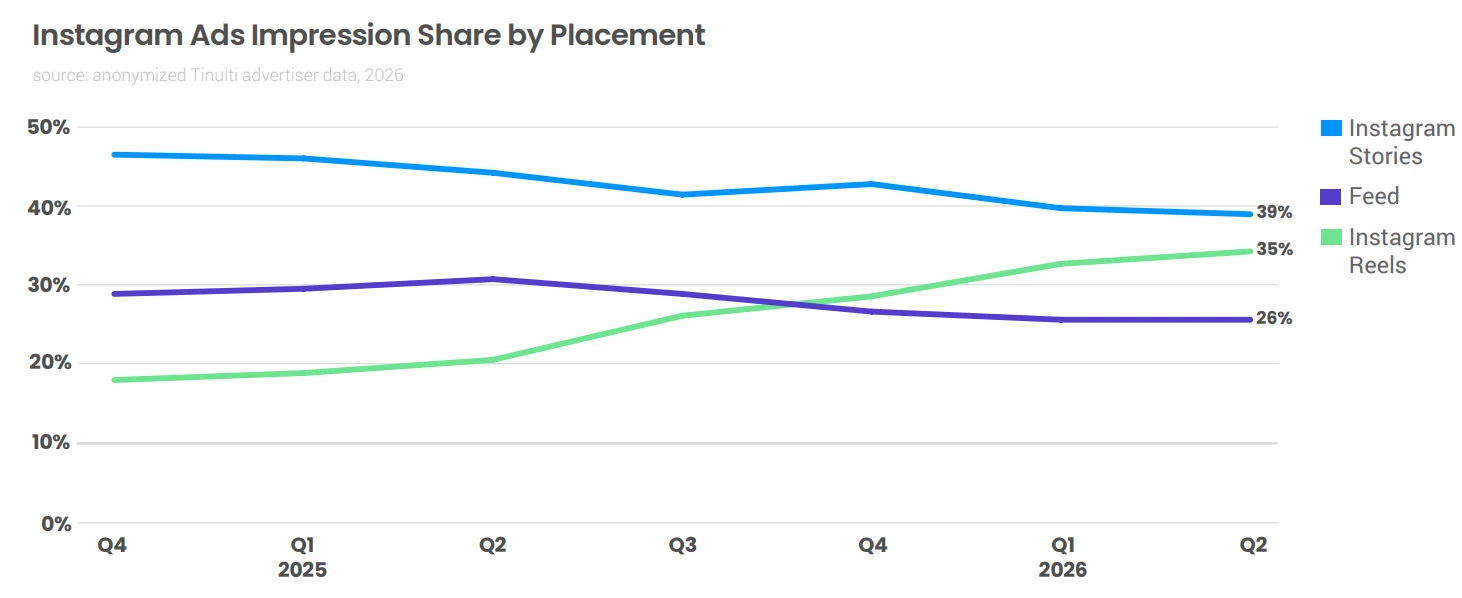
The distribution of ad impressions continued to shift toward short vertical video. The trend was observed on both Instagram and Facebook.
- In the second quarter, Reels accounted for 35% of ad impressions on Instagram. In the first quarter, the format’s share was 33%.
- At the same time, the share of the classic Instagram Feed dropped to 26%. Thus, Reels continued to cement its position as the platform’s largest ad format.
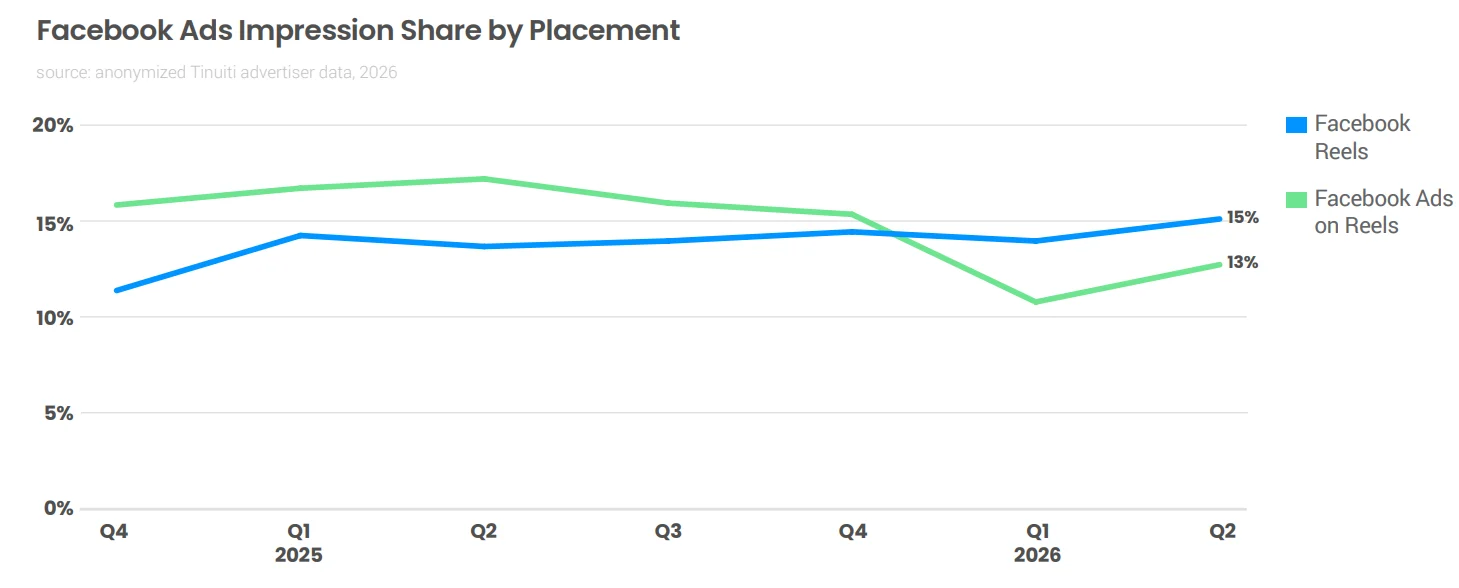
Facebook Reels accounted for 15% of video ad impressions on the platform. While the figure remains lower than on Instagram, the direction of change is similar: Meta is gradually increasing the presence of short vertical video in the ad inventory on both platforms.
Threads
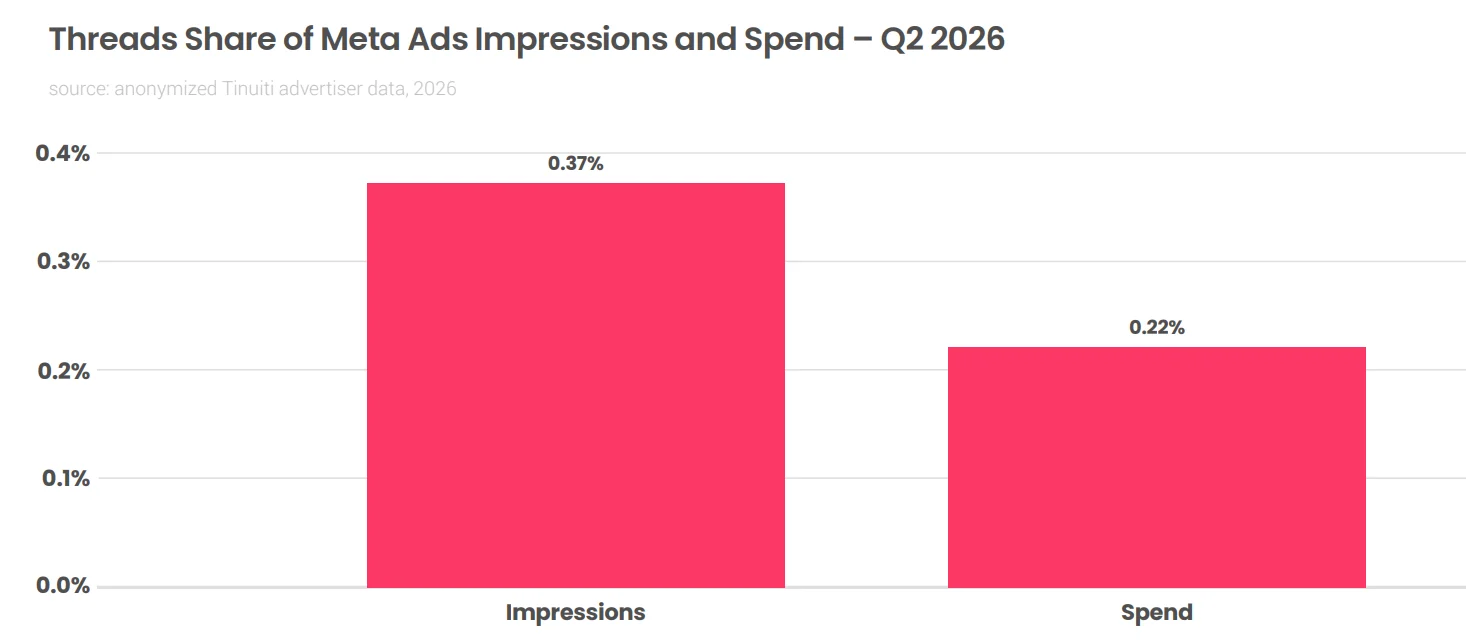
Advertising on Threads, launched in early 2025, still accounts for a statistically negligible share of Meta’s overall system — less than half a percent of all metrics.
- Threads’ share of ad views is 0.37% of total Meta impressions.
- Threads’ share of actual advertiser spend is even lower — 0.22%.
Meta vs. Alternatives
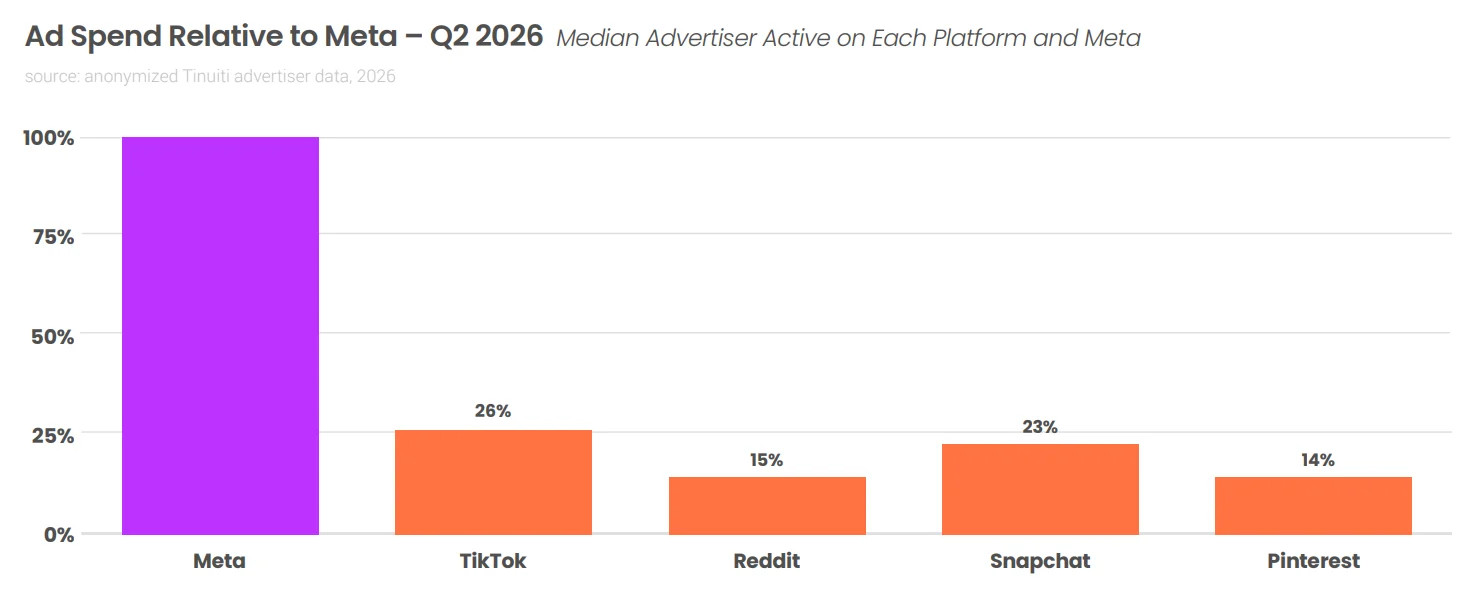
Below is the change in budgets on alternative platforms, as a percentage of Meta ad spend:
| Platform | Share in Q1 2026 | Share in Q2 2026 | Change (pp) |
| Snapchat | 14% | 23% | +9% |
| TikTok | 24% | 26% | +2% |
| 13% | 15% | +2% | |
| 15% | 14% | -1% |
- TikTok: Increased its share from 24% to 26%, cementing its status as the “co-pilot” in media mixes after Meta.
- Snapchat: The platform made a sharp jump from 14% to 23%.
- Reddit: Continued its steady gains, rising from 13% to 15%.
- Pinterest: Was the only player with negative momentum, dropping from 15% to 14%.
- More details in the Tinuiti Digital Ads Benchmark report.







Comments